Tags
Xcitium Client Security (XCS) what test Remote Control by ITarian RDS Server RDS EDR AEP csv access scope Comodo dialog box Windows UAC user access rights verification phone number password reset security code forgot password Android threat history generates alert lock device Android devices Mac OS devices mobile devices passcode Lock log SIEM log forwarding log storage log storage settings scan profile Parental control FLS file-lookup server internet access rights Real-time scan default profiles pre-configured profiles pre-defined profiles customize profile clone profile Clone unknown MAC profile Linux profile cloud-based service Maintenance Window maintenance analysis tool UFH check policy test policy Virtual Appliances DNS Resolver register invite graphs Dynamic IP Dome shield Integration O365 Comodo Office 365 removal tool CCS removal tool Comodo Secure Email Gateway subscriptions service Dome Antispam Valkyrie report info web Comodo SWG tutorial policy DLP PAC file iboss Bluecoat Websense Comodo Dome ICAP Dome Agent traffic URL C1 account SWG portal SSL Encrypted Traffic Dome Cloud enable widget chart endpoint dashboard file groups Rules exceptions Wi-Fi networks Wi-Fi setup security restrictions iCloud auto containment containment settings virtual file system sandbox environment client access control local configuration Comodo Client Security Rebranding Communication Client Rebranding security client re-brand Comodo Clients application rules global rules Portsets port sets Firewall ruleset rule set rulesets global proxy server global proxy antivirus settings Client Proxy remote control tool Firewall protection firewall settings configuration file export profile PowerShell VBS script Windows Standard Account Endpoint Manager Client Communication (EMCC) server security clients updates vulnerable security patches installed Client Communication Communication Client (CC) submission Communication Client tray icon script OS Patch Third Party Patch Installation Uninstallation Discovery additional package External Device Control external ITarian remote Windows device apps signed-in logged-in identify License wizard on-boarding local Comodo Client Security Mac devices Linux devices MSP customers EM profile Mac OS profile MAC OS X device user device configuration profile copy invoice enrollment Logging Settings SIEM tool external server Account Security mobile console EM device owners ownership remove MAC third party application remote uninstallation software inventory duplicate Name Master Image Golden Image Bulk Installation Package Windows Operating Systems summary information local time External IP address OS summary Devices list MDM profile iOS push certificate create APNs Apple account portal APN Apple Push Notification search bar filter options customer device group group membership managed device trust rating old duplicates removal device name MAC address MSP (Managed Service Provider) Versions Marketing & Sales Customer Relationship Management (CRM) Enroll New Device New Ticket quick actions bar release notes security status activity status profile status Sales funnel Secure Internet Gateway application launch Two factor Time zone Language Lockout time Change Password tokens device enrollment User Groups Manage Profiles User List Management customer report customer assessment customers End-User forms auto response attachments time entry address support User Directory scripts Knowledgebase canned Banlist announcements Hostname mail delivery CommandLine Power Shell PowerShell interface File Explorer Commands Interface Remote devices Remote Tools Paranoid Mode Training Mode Custom Ruleset Safe Mode The charging flow edit contracts Charging Flowchart Global Asset Rates Charging Plans Contracts charges calculated Remove role Edit a role staff interface Exclusions data loss prevention (DLP) network discoveries ITarian Remote Access Tool Tarian Remote Access Tool inactive devices Device removal settings Portal Set-up Malware File Name Security Sub-System communication client UI settings Communication Client Tray remove a department ticket submission configure department synchronize department submit ticket distributing Bandwidths client updates device management Bandwidth conservation malware activity virus scope autoruns Proxy servers fallback flag Inactive discovered devices SNMP Apple Device Enrollment Program set up service explorer manually deploy Comodo EDR agent parent process multiple ticket selection selected tickets security events folder transfer discoveries network management remote folder TLS TLS1.2 pci dss pci compliance ITarian Portal Endpoint Manager vdi environment vdi clone environment instant clone documentation vendor notice security dashboard events resolution remote tool partner onboard unknown file hunter TLS Encryption procedure parameters pass profiles history performance metrics real time remote endpoints download browse service URL Security Components system Global Software Inventory 2 minutes Integrate intagrate Active Directory Portable Interception SSL enable reporting Rule Threat Protection Rule Advance spam Customize archived outgoing incoming administrator validate domains add Antispam type PCI data loss Location Network information start software session extensions appoinments resource connection computers Comodo Rescue Disk infected opportunity opportunities custom relationship management quote COMODO-CRM protect mac device email notifications registry COM Quarantined point system restore msi contained applications processes security client events Release date department registration particular os section Two Factor Authentication Login interface dashboard report generate Direct Download Link One drive Google drive HIPS mode cleanup automatic suspicious suspicious certificates shellcode injection detect Elevated Access system user access default charging groups move current malware list store push IP address ip installer acronis auto-remediation server machine icon Product Logos rebrand backup Device Control data Chromoting WebRTC ports Protocol skip offline manual time entries ticket assignee Help Guide Tour schedule Reschedule appointment unknown application protection Virtual Desktop Local Verdict server manage calculation cost configuration charging SD contract prepaid hours products classification inventory analyze Device list OS patches global search bar Tool bar Windows Defender Security Center file group white Citrix record SPF work billable time onsite email template template variables emails Gmail SMTP disable Add collaborators admin action Audit logs feature requests submit vote remotely Reset proxy swg secure web gateway dome error disk ticket detail page thread section tickets section internal notes Sub-help topic help topic features Application control white_list Patch Management child parent scheduled customized get to headers columns company restrict customer technician remote access list iOS devices field Reports iOS device APN Certificate MAC OS X options Linux block Comodo Client Communication (CCC) allow Comodo Client Security (CCS) network zones active component tray icon hide show packages additional install block port baseline installation package bulk implement restrict firewall endpoints security and communication global export virus import Database folders files define exclusions change staff admin rating check reassign assign permissions new role create for user of device enroll associated use how profile specific Removing Devices Uninstall windows profile Configuration templates latest version clients comodo file ratings monitoring custom All Devices Ratings Track widgets Agent valkyrie malware files Kill chain report automated establishing endpoint remote session Users prevent Android organization windows assets Mac OS billing identified threats Sort Closed inside Program executed containment service desk remote control Locally runs update scan antivirus SLA Business Hours control CCS Password access Client Auto Specific Device Response Application Third party Status View Logs intended devices alert fails Company Information Configure Verdict Patch Procedures Executable Comodo Internet Security ITSM Analysis Command Line Heuristic Filter Unrecognized Trusted File Rate Malicious Purge Calendar Device Exclusion USB Admin Panel Settings ticket Default system-wide Specific Path Details Monitor Multi Set Currency Connected Who Quick Actions Comparison Version Enterprise Managed Service Provider C1 Portal Remote management Comodo Remote Control ticket management staff panel assign tickets
More

How to generate reports in the ITarian portal

Release Time
04/06/2020
Views
none
Categories
ITarian Portal
Tags

Login to ITarian > Click 'Reports' on the menu bar

The reports interface lets you generate reports on:

  • Service desk tickets
     
  • Managed devices
     
  • Malware identified on managed devices
     
  • Files discovered on managed devices
     
  • Files submitted to Valkyrie for analysis and their verdicts

You can generate a report on demand, or schedule automatic reports at set intervals

This article explains how to generate reports in ITarian, but you can also create reports in the Endpoint Manager and Service Desk applications themselves.

  • See this help page if you need help to create reports in Endpoint Manager
     
  • See this wiki if you need help to create reports in Service Desk

Use the links below to jump to the task you need help with:

The ITarian reports interface

  • Login to ITarian
     
  • Click 'Reports' on the menu bar

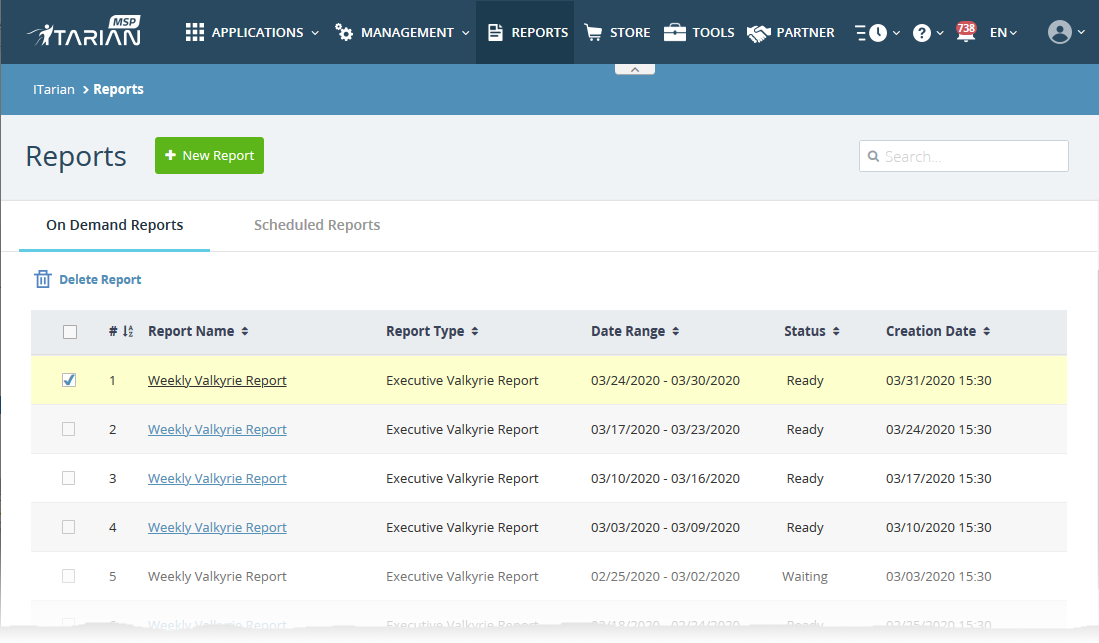
The interface has two tabs:

  • On Demand Reports - Manually generated reports
     
  • Scheduled Reports - Created automatically at time intervals of your choice

Report Name - Label of the report. You specify the report name when you create the report.

Report Type - Module which the report concerns. For example, 'Executive Ticket Summary Report', 'Executive Managed Devices Report' and 'Executive File Statistics Report'

Date Range/Period - Time period covered by the report.

Schedule - Report frequency. Applies to scheduled reports only.

Status - The current stage of the report.

On-demand reports have the following statuses:

  • Waiting - Report is awaiting a place in the queue
     
  • Requested - Report is queued for production
     
  • In-progress - Report is currently being created
     
  • Ready - Report is available to view and download
     
  • Failed - ITarian encountered an error when creating the report

Scheduled reports have the following statuses:

  • Active - The report will be generated at the scheduled times.
     
  • Inactive - The scheduled report is disabled.

You can activate or deactivate a schedule using the options at the top. See View and manage report schedules if you want help with this.

Creation Date - Date and time the report was generated.

Create or schedule reports

Click 'Reports' > 'New Report'

You can run reports on-demand, or create a schedule to auto-generate reports at set times. You can create the following types of report:

  • Executive Managed Devices Report - Summary of your EM device fleet as it stands. Includes total # devices overall, # of PCs/servers/smartphones
     
  • Executive Windows Antivirus Report - Summary of antivirus protection and threat levels on your network. Includes # devices with AV installed, number of infected/clean devices, scan status and more.
     
  • Executive Ticket Summary Report - Details about Service Desk tickets, including number of open/closed tickets, billable time, hours spent, etc
     
  • Executive File Statistics Report - Summary of the trust level and status of files on your managed devices. Shows the # unknown files, # malware files, # quarantined files etc
     
  • Executive Valkyrie Report - Lists white-listed and blacklisted files on your managed devices.

Run a report or create a schedule

  • Click 'Reports' on the menu bar
     
  • Click 'New Report' on the top:


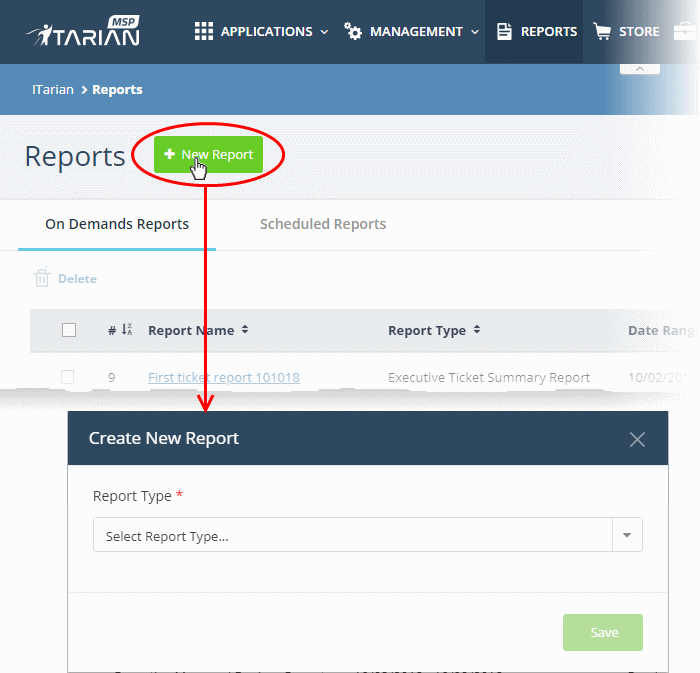
  • Choose the report type from the options.


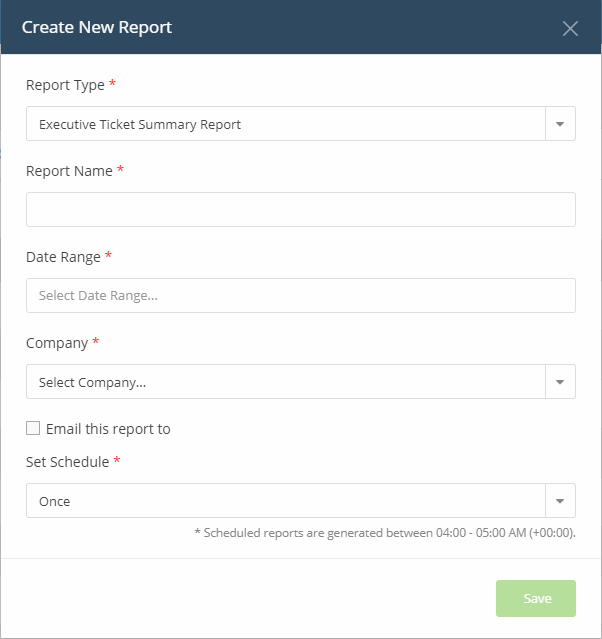
Report Name - Enter a descriptive label for the report.

Date Range - Click inside the field to choose the time period covered by the report.


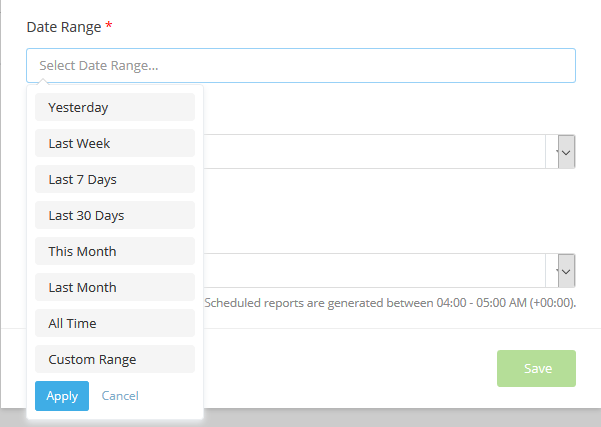
  • Click 'Custom Range' to choose specific start and end dates.
     
  • Click 'Apply' to confirm your date range

Company - Organization whose devices/ files/ tickets are covered by the report

  • MSP customers - Select the target company from the drop-down
     
  • Enterprise customers -  Cannot change the target company

Email this report to - Enter the addresses of admins to whom you want to send the report. You can add multiple email addresses in the field. Press 'Enter' after each address.

Set Schedule - Select the frequency at which the report should be generated. Please note, the 'Set Schedule' feature is not available for custom date range.

The available options are:

  • Once - A one-off report. There will be a slight delay while the report is generated. The report will appear in the list when ready.
     
  • Daily - The report is generated every day
     
  • Weekly - The report is generated every week on the day the schedule was created.
     
  • Monthly - The report is generated once per month on the day of the month that the  schedule was created.

Click 'Save'.


Note: Daily, weekly and monthly reports are generated between 04:00-05:00 AM (UTC).


View the reports

  • Click 'Reports' on the menu bar
     
  • Click 'On-Demand Reports' to view manually generated reports, or 'Scheduled Reports' to view auto-generated reports
     
  • Click on the name of a report to view it.


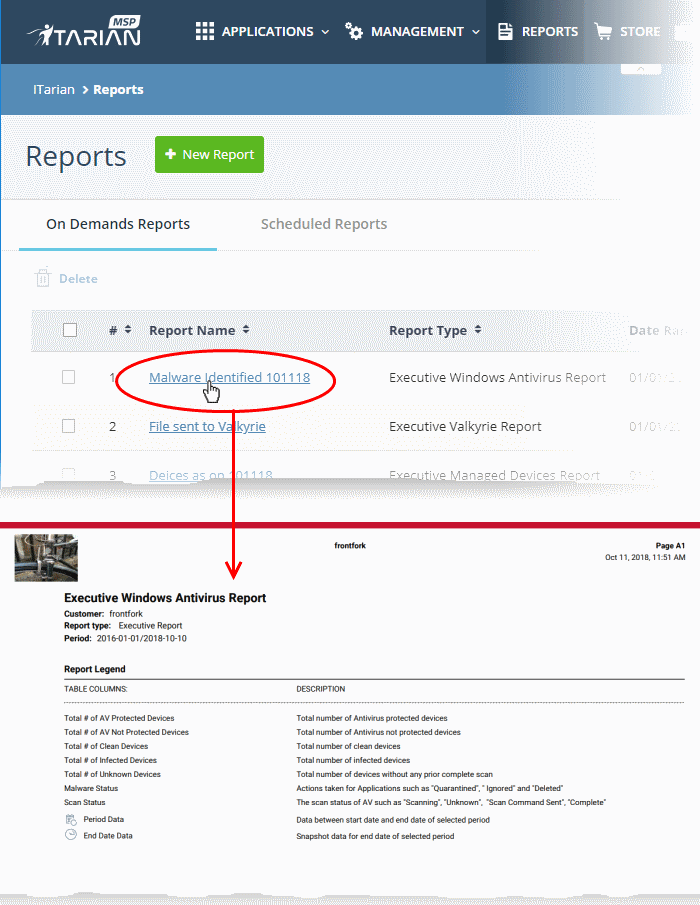
  • The report opens in pdf format. Click the download button to save a copy.

View and manage report schedules

  • Click 'Reports' on the menu bar
     
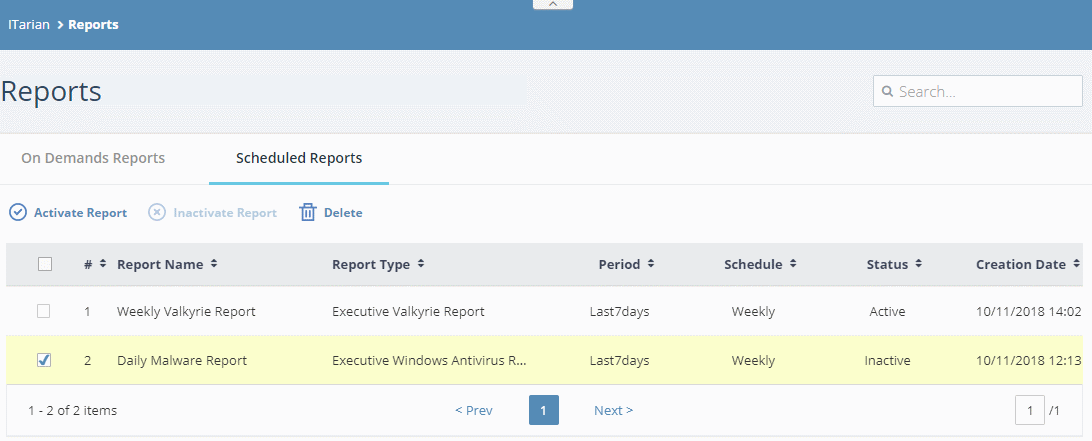
  • Click the 'Scheduled Reports' tab
     
  • Click a report name to view it as a pdf

Select reports using the check-boxes on the left to perform the following actions:

  • Inactivate Report - Stops the report from being generated at the scheduled times
     
  • Activate Report - Resume automatic report generation at the scheduled times
     
  • Delete - Removes the schedule from the list.


Further reading:

How to generate reports in Service Desk

Generate reports in Endpoint Manager