Click 'Network Management' > 'Discoveries' to open the scan configuration area
Introduction
Click 'Network Management' > 'Discoveries' to open this interface.
- The discovery feature lets you scan networks and active directory (AD) servers to identify all devices on the network.
- The scan will identify both managed and unmanaged devices. You can configure EM to alert you if a scan finds new devices.
- You can run simple network scans from a ‘probe device’ situated in the target network. The probe device must be a managed Windows endpoint which has already been added to Endpoint Manager.
- You can scan Active Directory servers either with or without the use of a probe device.
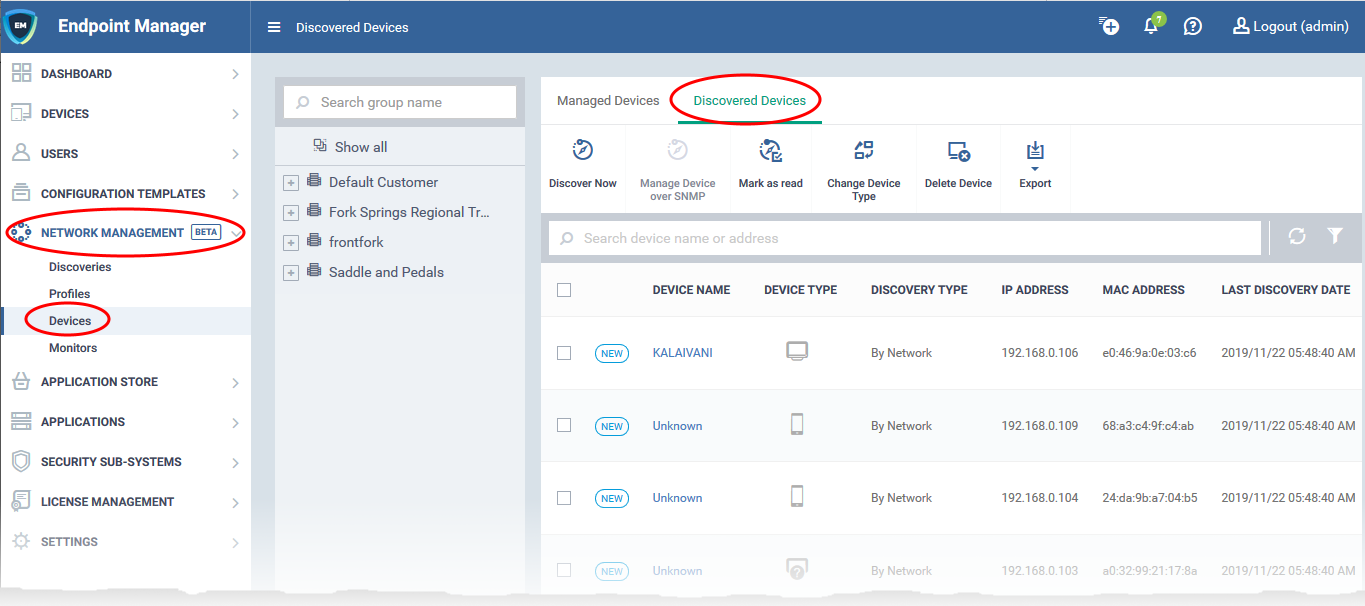
- All discovered devices are shown in 'Network Management' > 'Devices' > 'Discovered Devices':
Notes:
- All newly discovered devices are 'Unmanaged'. This means you can’t yet control them with Endpoint Manager. You need to install the communication client on the devices to enroll them.
- All discovered devices are placed into a group of your choice. You can then create a client installation package for the group and use Comodo's auto-deployment tool to install it. This will enroll the devices to the endpoint manager.
- You can change the owner and group of these devices after they have been enrolled. Full auto-enrollment of discovered devices is coming in later releases.
Preliminaries
- Optional – Make sure your probe device is in place. It can be any managed Windows endpoint inside the network that you want to scan. This device will launch the scans you request on the target network. The probe is required for network and SNMP scans but is optional for Active Directory scans.
- Create a new group for discovered devices under the company of your choice:
- Login to ITarian
- Click 'Application' > 'Endpoint Manager'
- Click 'Devices' > 'Device List' > 'Group Management' > 'Create Group'.
- Name the group, for example, 'Discovered Devices - Company X'.
- Do not add any existing devices to this group. Leave it empty. The group is pure to segment the discovered devices. You can move devices to different groups after they have been enrolled.
Create a discovery scan
There are two types of discovery task:
- Network - Scan an IP range using a probe device. The probe must be a managed Windows device connected to the network. You can run a concurrent SNMP scan when you run a network scan.
- Active Directory – Scan an Active Directory domain for devices. You can configure the scan with or without a probe device. If not specified, EM will directly scan the AD server.
Network Discovery Scan
- Login to ITarian
- Click 'Application' > 'Endpoint Manager'
- Click 'Network Management' > 'Discoveries'
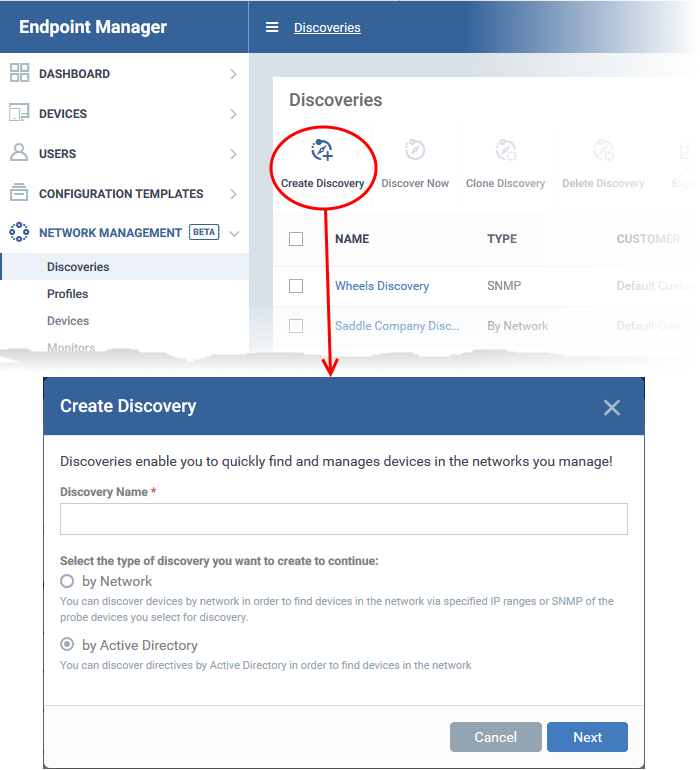
- Click 'Create Discovery'

- Discovery Name - Create a label for the discovery task. Ideally, the label should help you identify the target or purpose of the task in the future.
- Select 'by Network'
- Click 'Next' to add probe devices.
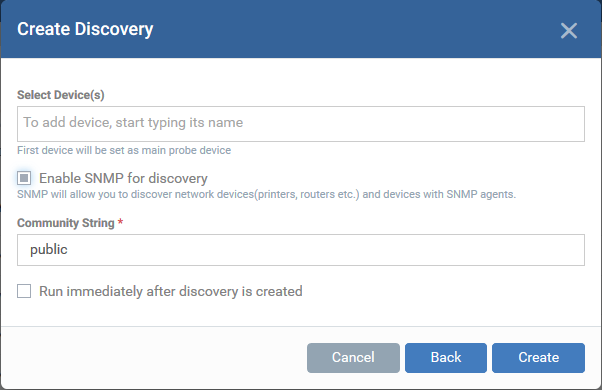
- Select Device(s) – Start typing the name of the device you want to use as the probe and select from the suggestions.
- A probe device is a managed Windows endpoint inside the network that you want to scan. The device must already be enrolled to Endpoint Manager and have communication client (CC) 6.32 or higher installed. This device will launch the scans you request on the target network.
- You can also add additional devices for fail-over. The device added first will be used as the probe. If the first device is offline then EM will use the next device for the scan.
- Enable SNMP for discovery – Run a simple network management protocol (SNMP) scan alongside the network scan.
- If enabled, the SNMP scan will run simultaneously with the IP range scan.
- The SNMP results are shown as a separate row in the 'Network Management' > 'Devices' > 'Discovered Devices' interface.
- Community String - This is a passcode sent with each SNMP Get-Request to authenticate access to a router or other device. If the community string is correct, then the device responds with the requested information.
- Run immediately after discovery is created - The discovery scan will start after it is saved.
- Click 'Create'
The discovery task configuration screen opens:
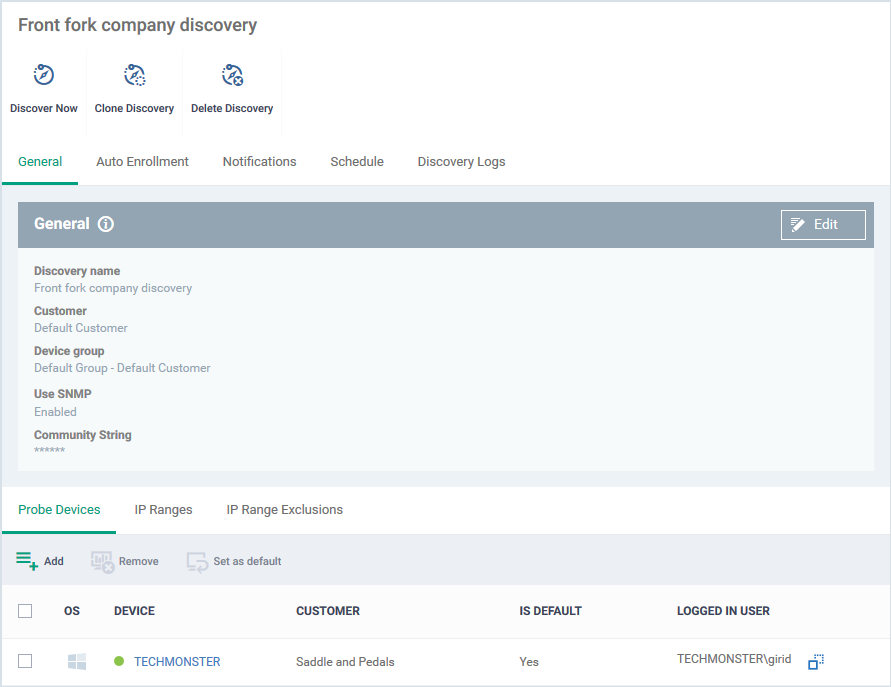
- General - Specify the IP addresses you want to scan. Set the customer and device group to which new devices should be assigned. Choose your probe device.
- Auto Enrollment - Windows devices only. Set the customer and device group to which you want to assign discovered Windows devices. Complete the instructions in the ‘Auto Enrollment’ tab on the probe and target devices.
- Notifications - Select which events you want to be notified about. Events include when the scan ends, when a new device is found, and when a new IP is found. (Optional)
- Schedule - You can automate the discovery scans by scheduling them to run daily, weekly or monthly. (Optional)
- Discovery Logs - View the results of previous scans run under this task. You can see the date, type and other general details about a scan. Click 'Details' then 'Click Here' to view a list of devices found by the scan.
- Next, click 'Edit' on the right to configure scan targets and options.
General Settings
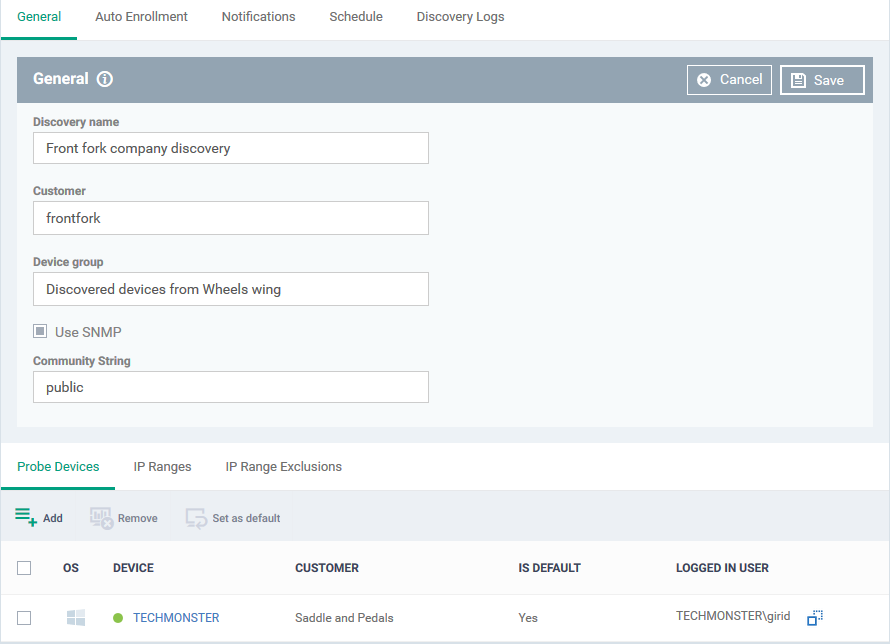
- Discovery name - This is pre-populated with the label you created in the previous step. Edit the name, if required.
- Customer - Specify the company that owns/controls the target network.
- Enter the first few letters of a company name and select from the suggestions.
- Device group - Specify the group to which discovered devices should be assigned. The device group must belong to the 'Customer' named in the previous row.
- Enter the first few letters of the device group and select from the suggestions.
- SNMP – Pre-populated with the choice you made in the previous step. Change the choice if required.
- If enabled, the SNMP scan will run simultaneously with the IP range scan.
- SNMP results are shown as a separate row in the 'Network Management' > 'Devices' > 'Discovered Devices' interface.
- Community String - This is a passcode sent with each SNMP Get-Request to authenticate access to a router or other device. If the community string is correct, then the device responds with the requested information.
Most network vendors ship their equipment with a default password of "public". This is the so-called "default public community string".
- Probe Devices – Pre-populated with the list of probe devices you specified in the previous step. You can add a new probe as follows:
- Click 'Add' at top-left:
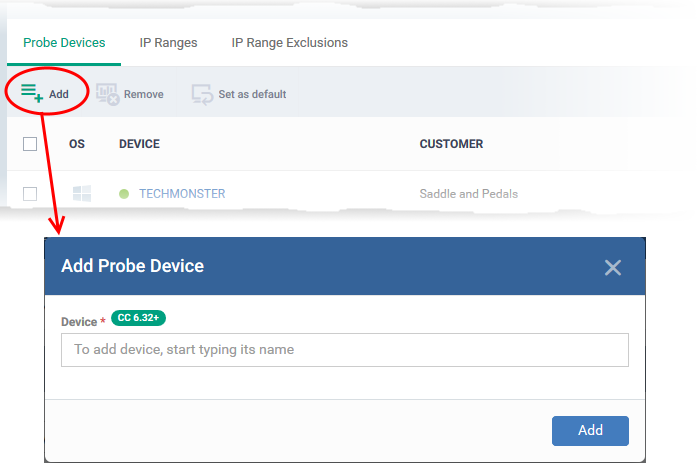
- Start typing the name of the device you want to use as a probe. Select from the suggestions.
- You can add multiple devices for fail-over if required. You must choose a default probe if you add multiple probes. The other probes are only used if the default is not available.
- IP Ranges - Specify the IP address range that you want to scan for connected devices. You can add any number of IP ranges within the network for a single discovery task. You can also specify addresses to be skipped as exclusions.
- Leave this blank if you want to scan the entire network to which the probe is connected.
- Click 'Add' to add the IP range to the list.
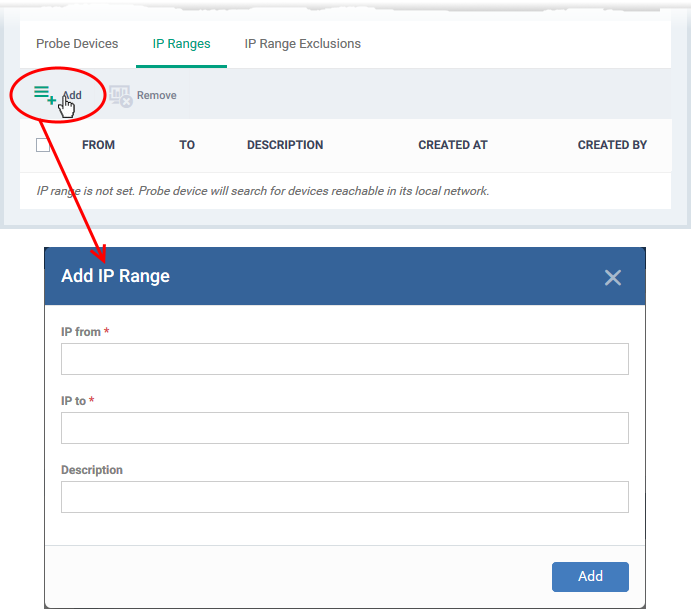
- IP from - Start address of the IP range
- IP to - End address of the IP range
- Description - A brief description of the IP range (optional). Use this if there are different IP segments that you want to identify. You can enable or disable ranges as required in any scanning task.
- Repeat the process to add more IP address ranges
- Select an IP range and click 'Remove' to delete the IP range from the list
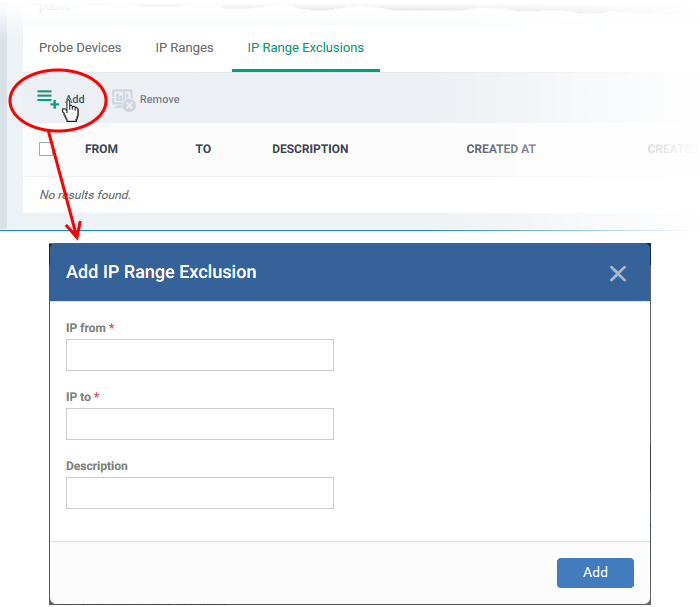
- IP Range Exclusions - Specify IP addresses that should not be scanned.
Auto Enrollment
- You must download and install PsTools on the probe device before you can use the auto-enrollment feature.
- You also need to enable NetBIOS over TCP/IP on target devices.
- Read the full instructions on the ‘Auto Enrollment’ page and complete the steps therein.
Auto-enroll devices:
- Click the 'Auto Enrollment' tab
- Click the 'Edit' button at the top-right
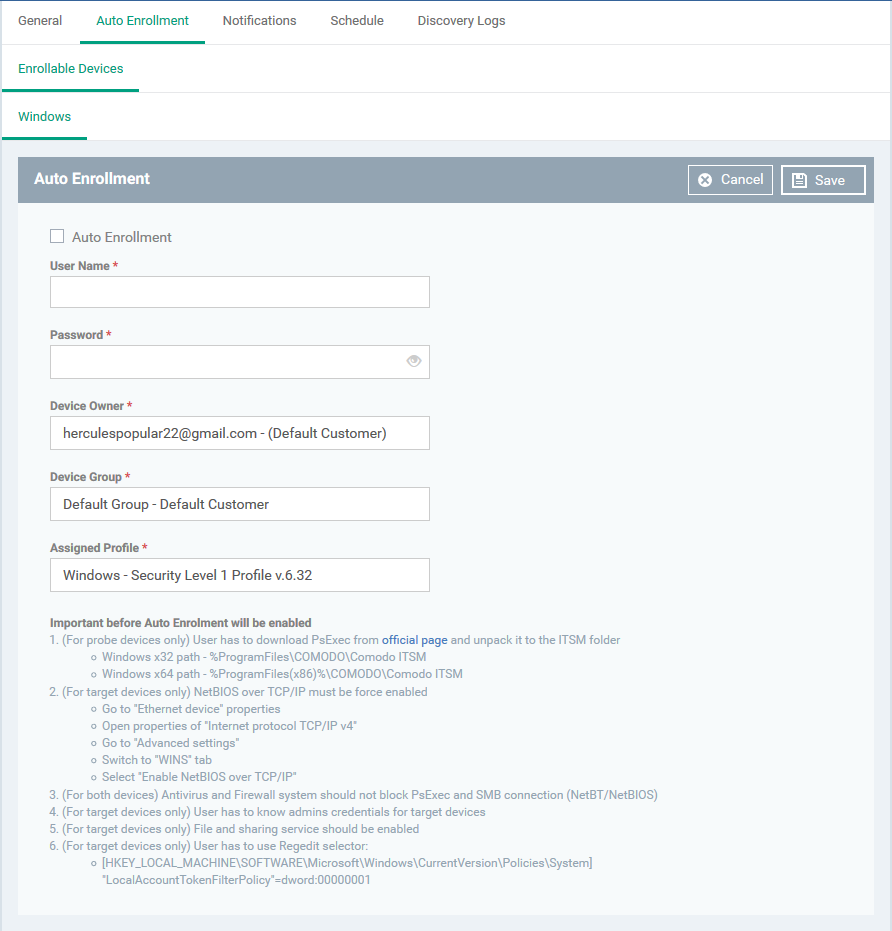
- Auto Enrollment - Enable this to auto-enroll discovered Windows devices to EM
- User Name / Password - Admin credentials for the target devices.
- Device Owner - Select the admin of the customer that you selected in the general tab. The devices are assigned to this admin after enrollment. You can assign the device to the appropriate user later. Start typing a name and select from the suggestions.
- Device Group - Choose the group to which you want to assign auto-enrolled devices. Start typing the group name and select from the suggestions.
- Assigned Profile - Choose the profile you want to apply to discovered devices. Start typing a profile name and select from the suggestions. Note - The security client has to be installed for the profile to take effect.
- Click 'Save' to apply your changes
Next - Run the discovery scan
AD discovery scan
- Login to ITarian
- Click 'Application' > 'Endpoint Manager'
- Click 'Network Management' > 'Discoveries'
- Click 'Create Discovery'
- Discovery Name - Enter a label for the new discovery task. Ideally, the label should help you identify the target or purpose of the task in the future.
- Select 'by Active Directory'
- Click 'Next'.
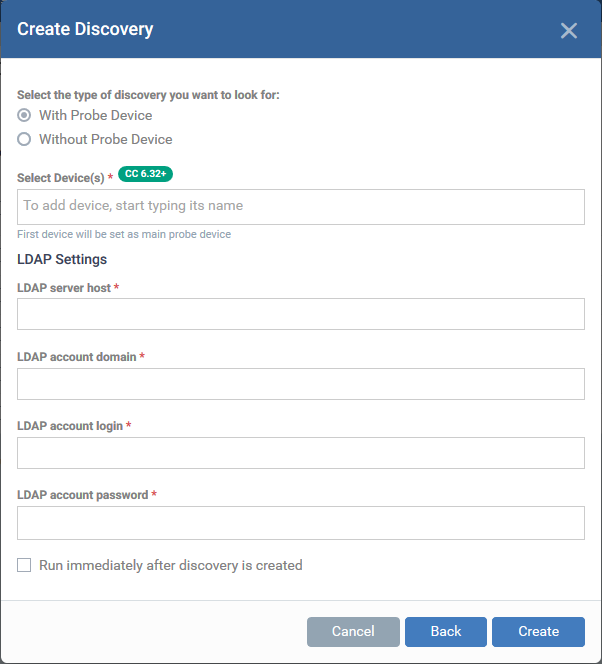
Select the type of discovery: There are two options:
- With Probe Device – Specify a probe device to run the discovery scan on the AD domain.
- Select this option if the AD server is not directly accessible over the internet.
- A probe device is a managed Windows endpoint on the same network to which the AD server is connected.
- The device must already be enrolled to Endpoint Manager and have communication client (CC) version 6.32 + installed. This device will launch the scans you request on the target network.
- The probe device need not be a member of the AD domain
- If selected, specify the probe device you want to use in the 'Select Devices' field
- Without Probe Device - The discovery scan will be run directly by EM
- Select this option if the AD server is accessible through the internet.
- You need not specify a probe device to run the scan.
- Select Device(s) – Applies only if 'With Probe Device' is chosen.
- Start typing the name of the device you want to use as probe and select from the suggestions.
- You can also add additional devices for fail-over. The device added first will be used as the probe. If the first device is offline at the time of discovery, EM will use the next device and so on.
LDAP Settings:
- LDAP server host – Enter the IP address or hostname of the AD server that hosts the AD domain
- LDAP account domain – Enter the domain name of the AD domain
- LDAP account login and LDAP account password - The admin username and password required to access the AD server.
Run immediately after discovery is created - The discovery scan will start after it is saved.
The discovery task configuration screen opens:
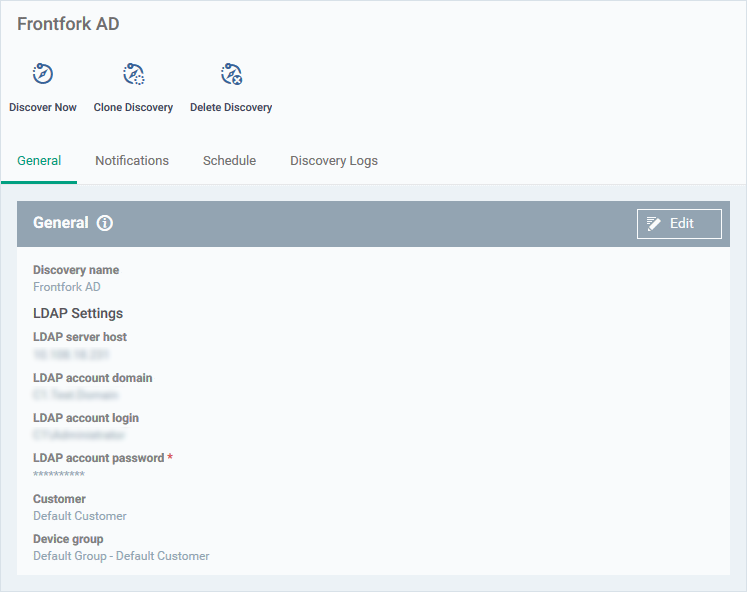
- General – Edit the LDAP details of the AD server you want to scan. Set the customer and device group to which new devices should be assigned. Choose your probe device.
- Notifications - Select which events you want to be notified about. Events include when the scan ends and when a new device is found. (optional)
- Schedule - You can automate the discovery scans by scheduling them to run daily, weekly or monthly. (optional)
- Discovery Logs - View the results of previous scans run under this task. You can see the date, type and other general details about a scan. Click 'Details' then 'Click Here' to view a list of devices found by the scan.
Click 'Edit' on the right to get started.
General Settings
- Click the 'General' tab (if it is not already open)
- Click the 'Edit' button at the top-right
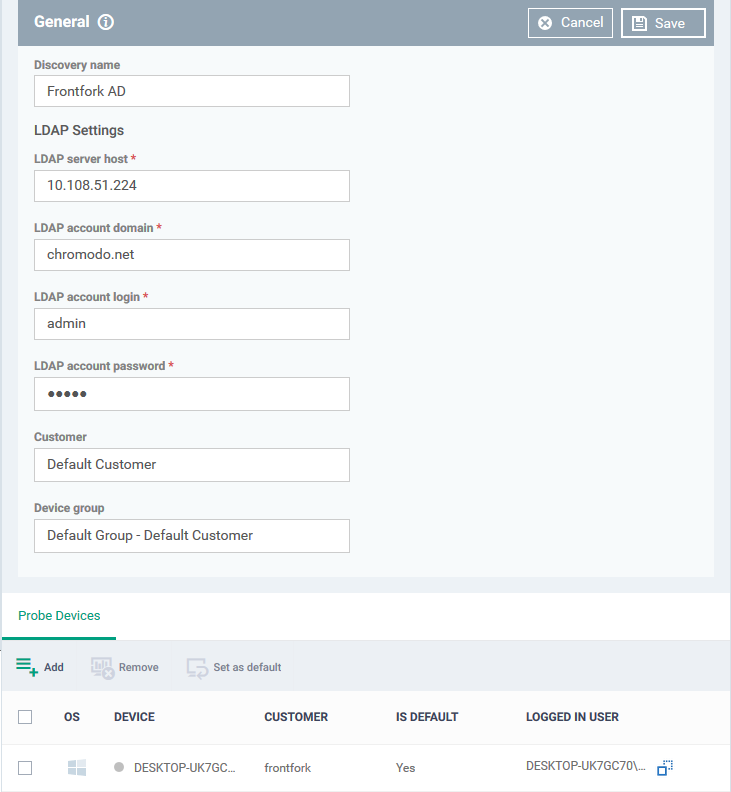
- Discovery name - This field is pre-populated with the label you created in the previous step. Edit the name, if required.
- LDAP Settings – The hostname of the AD server, AD domain name, AD admin username, and password are pre-populated from the details you entered in the previous step. Modify them if required.
- Customer - Specify the company that owns/controls the target AD network.
- Enter the first few letters of a company name and select from the suggestions.
- Device group - Specify the device group to which identified devices will be assigned. The device group must belong to the 'Customer' named in the previous row.
- Enter the first few letters of the device group and select from the suggestions.
- Probe Devices – Applies only if you have chosen 'With Probe Devices' in the previous step. The list is pre-populated with the probe devices you specified in the previous step. You can add or remove devices if required.
Add a probe device:
- Click 'Add' at the top-left:
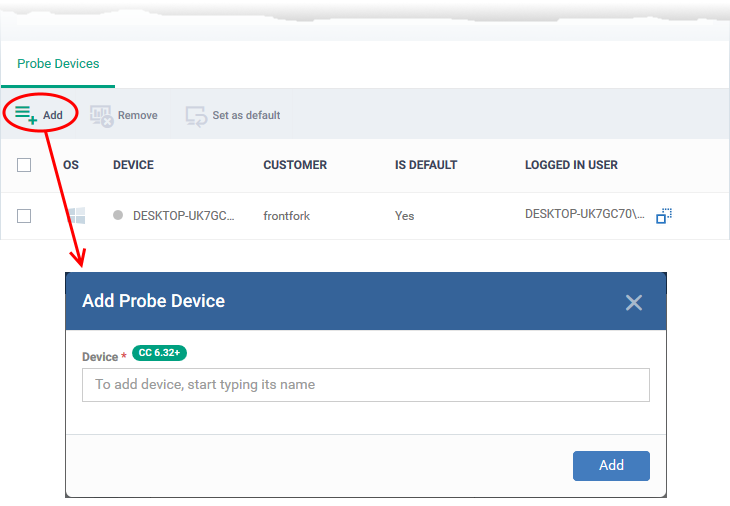
- Start typing the name of the device you want to use as the probe then select from the suggestions.
- You can also add additional devices for fail-over. The device added first will be used as the probe. if the first device is offline at the time of discovery, EM will use the next device and so on.
- Click 'Add'.
- Repeat the process to add more probes. Multiple probes act as fail-overs for each other.
- You must select a default probe for scans if you add multiple probes. The other probes will only run the scan if the default probe is not available
- Click 'Save'
Run a Discovery Task
- Click 'Network Management' > 'Discoveries'
- Select the discovery scan task from the list and click 'Discover Now' on the top
- Alternatively, click the name of the discovery task and click 'Discover Now':
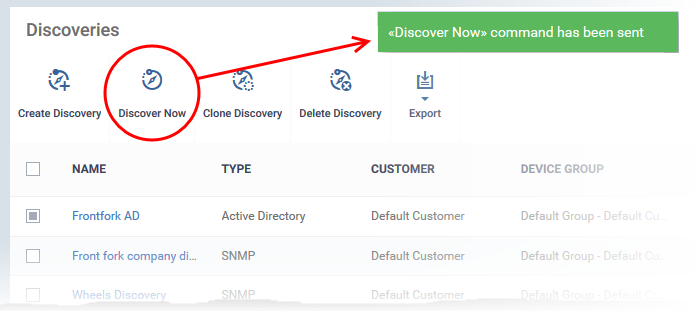
- The scan will start and will run for ten minutes. Any SNMP scans will start simultaneously.
- All discovered devices will appear in 'Network Management' >'Devices' > 'Discovered Devices'
- You can bulk enroll discovered Windows devices by bulk installing the communication and security clients. See this wiki for more help.
View and manage discovered devices
You can view the details of devices identified by a discovery scan. You can also change the name of discovered network devices, for easy identification.
- Click 'Network Management' > 'Devices'
- Click the 'Discovered Devices' tab
- Select a company or a group to view the list of devices identified in that group
OR
- Select 'Show all' to view every discovered device
- Click the name of any discovered device to open its device details interface
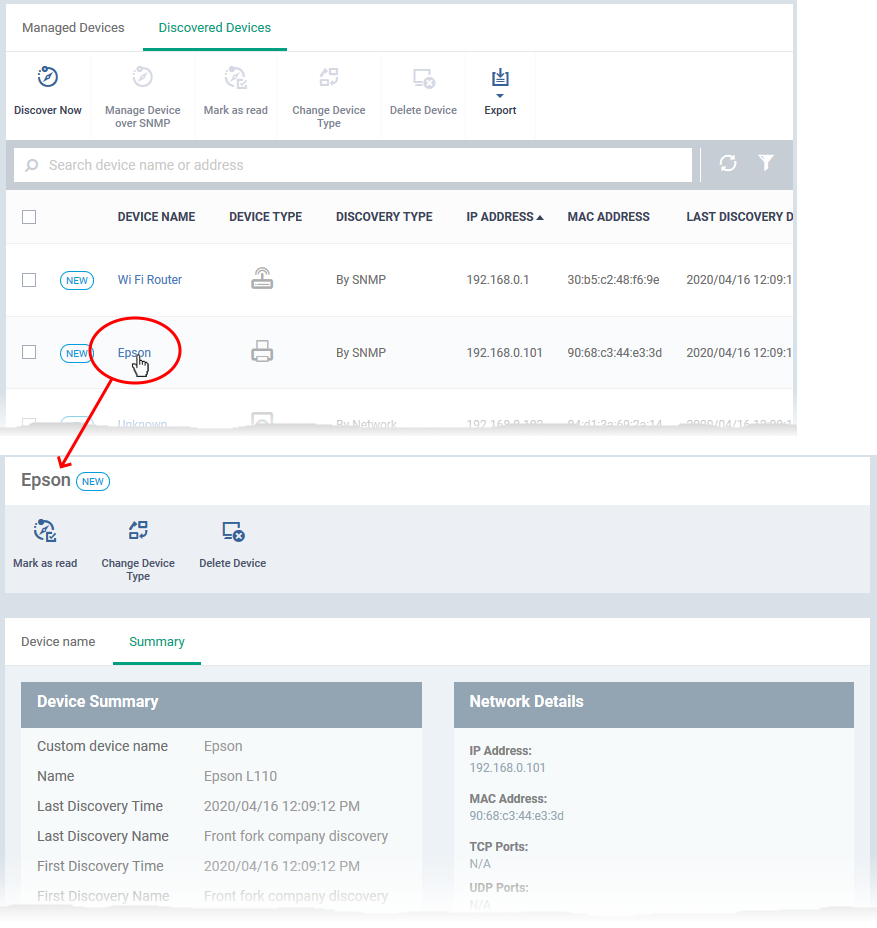
The details screen has two tabs:
- Device name – The label of the device. You can change the device name if required.
- Summary - General hardware and network details.
The controls above the table let you perform various tasks:
- Mark as read – Devices that are identified for the first time are marked 'New' in the Discovered Devices interface. Use this control to remove the 'New' tag, The device will not be flagged as new in the future scans.
- Change Device Type - Change the device category in case it was detected incorrectly after a scan. See Change Device Type if you need more help with this.
- Delete Device - Remove the device from the list. If a deleted device is discovered again in subsequent scans, it will be shown as a new device.
View and edit device Name
- Click the 'Device Name' tab in the device details interface
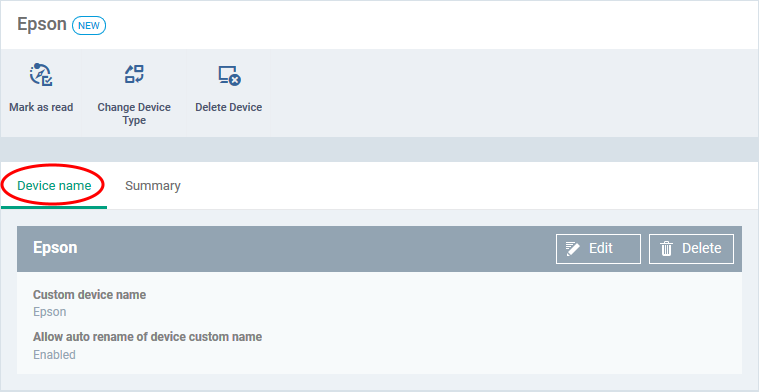
Custom device name - The current name of the device.
Allow auto rename of device custom name - Indicates whether the actual device name will automatically replace any custom name during the next sync.
- Click the 'Edit' button at the right to change the name of the device.
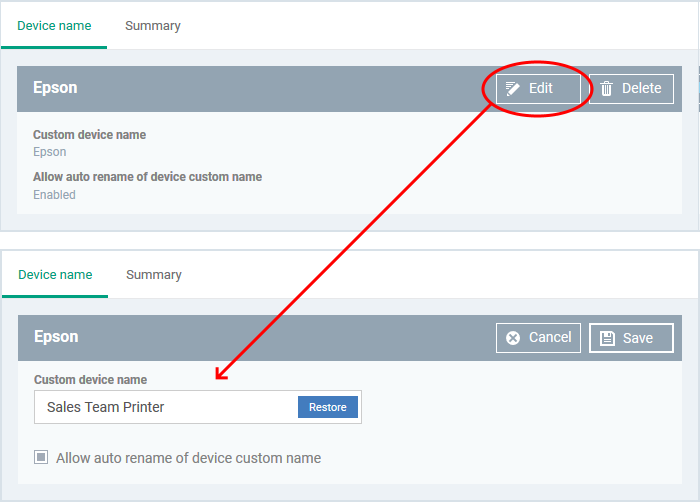
- Enter the new name in the 'Custom Device Name' field
- Make sure the 'Allow Auto Rename of Device Custom Name' is disabled to retain the custom name in the list. If this is enabled, the custom name will be automatically replaced with the device's name or model number during the next sync of the probe device with the EM server.
- Click 'Save' for your changes to take effect.
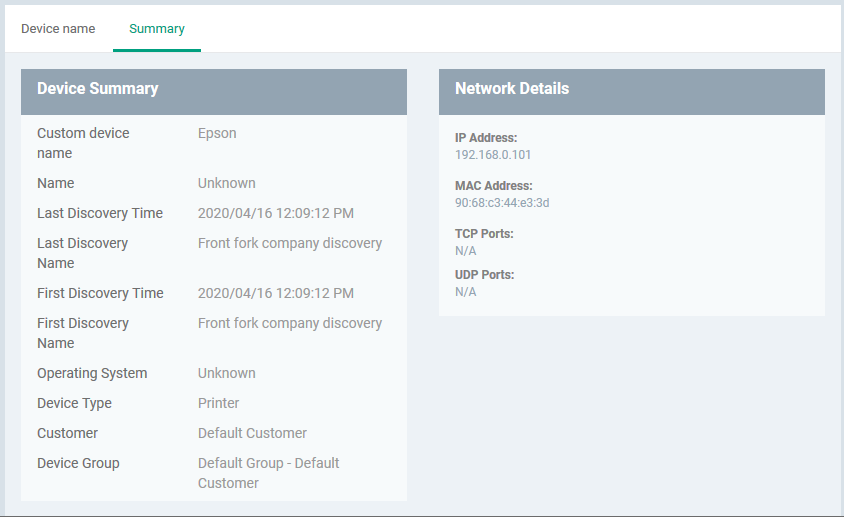
View Device Summary
The summary page contains general information about the device. This includes IP / MAC address, discovery times, and device type.
- Click the 'Summary' tab in the device details interface
Change Device Type (Optional)
You can change the device category in case it was detected incorrectly after a scan.
- Click 'Network Management' > 'Devices'
- Click the 'Discovered Devices' tab
- Select a company or a group to view the list of devices identified in that group
OR
- Select 'Show all' to view every discovered device
- Select the devices that you want to change the category
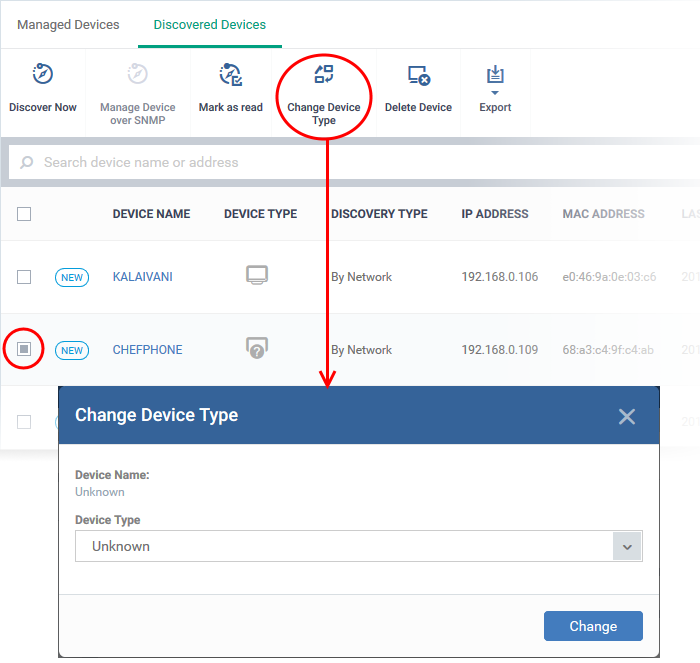
- Select the device type from the drop-down
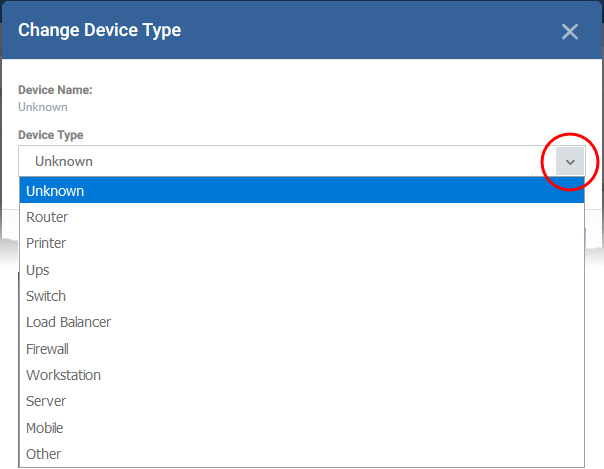
The category will change with the appropriate icon in the device type column.
Manage SNMP Devices (Optional)
- Endpoint Manager is capable of detecting SNMP devices in a discovery scan. You should have enabled SNMP detection when setting up the network scan.
- The SNMP feature provides simple management of devices that don’t run a supported operating system (Windows, Mac, Linux, etc). SNMP devices are usually items like UPS, printers, routers, switches, etc.
- You can apply a simple network profile to these devices which alerts you if the device has been powered on or off for a certain period of time.
Move SNMP devices to management
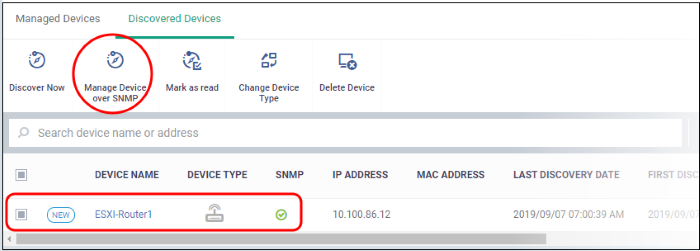
- Click 'Network Management' > 'Devices'
- Click the 'Discovered Devices' tab
- Select a company or a group to view the list of devices identified in that group
Or
- Select 'Show all' to view every discovered device
- Select an SNMP compliant device then click 'Manage Device over SNMP'