Click ‘Applications’ > ‘Endpoint Manager’ > ‘Configuration Templates’ > ‘Monitors’
- A monitor is a script that tracks the activity on a managed endpoint and alerts you if its conditions are met.
- For example, you could create a monitor that alerts you if CPU usage goes above 75% for a certain length of time.
- You add the monitor to a configuration profile which is in-turn applied to your devices.
- A single monitor can be used in multiple profiles. A single profile can include any number of monitors.
- Endpoint Manager ships with a set of canned monitors that you can quickly deploy. You can also create custom monitors to track items of your choice.
- You can create new monitors from scratch, or clone an existing monitor then edit it as required.
This article explains how to create a monitor, add it to a profile, and view monitor logs.
The monitors area
- Login to ITarian
- Click 'Applications' > 'Endpoint Manager'
- Click 'Configuration Templates' > 'Monitors'
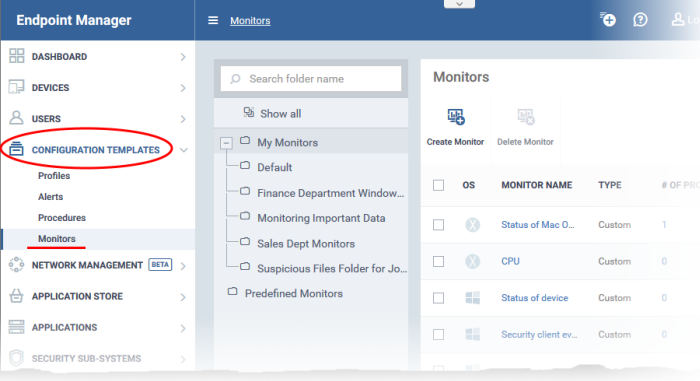
There are two types of monitor:
- Predefined Monitors - A collection of monitors from Comodo which perform a range of useful monitoring tasks. These can be used in custom profiles, but cannot be edited.
- My Monitors - Custom monitors that you create. These monitors are saved in the 'My Monitors' folder. You can add custom sub-folders as required.
There are two ways to add custom monitors:
Create a new monitor from scratch
- Click 'Configuration Templates' > 'Monitors'
- Click 'Create Monitor'
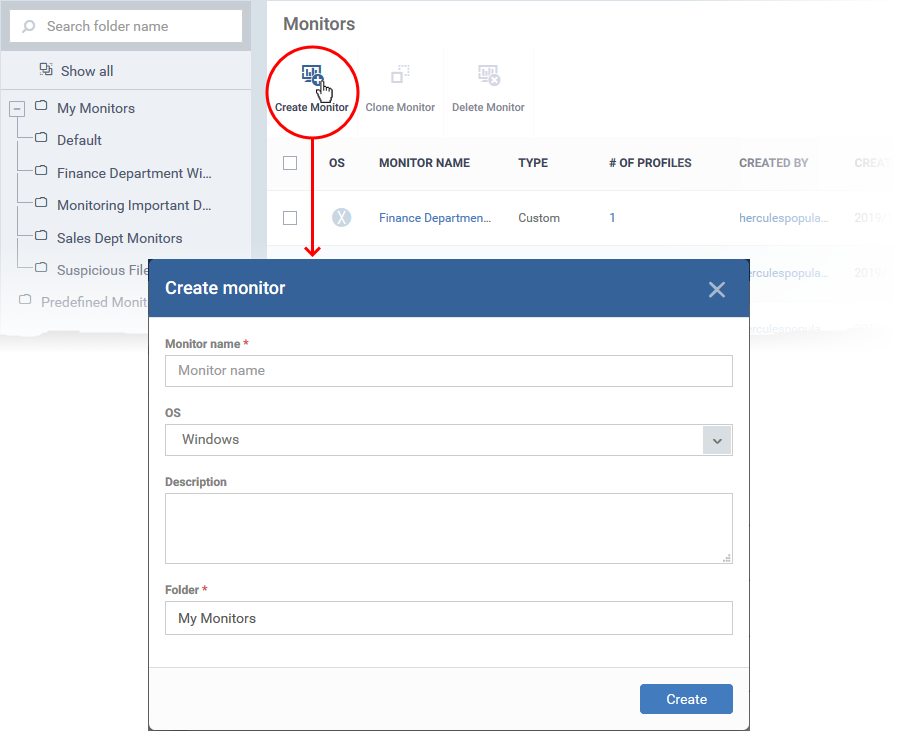
General Settings
- Enter a label and description for the monitor
- Select the operating system of the target device. Supported operating systems are Windows and Mac OS.
- Specify where to save the new monitor. You can create new sub-folders under 'My Monitors' if required.
- Click 'Create'.
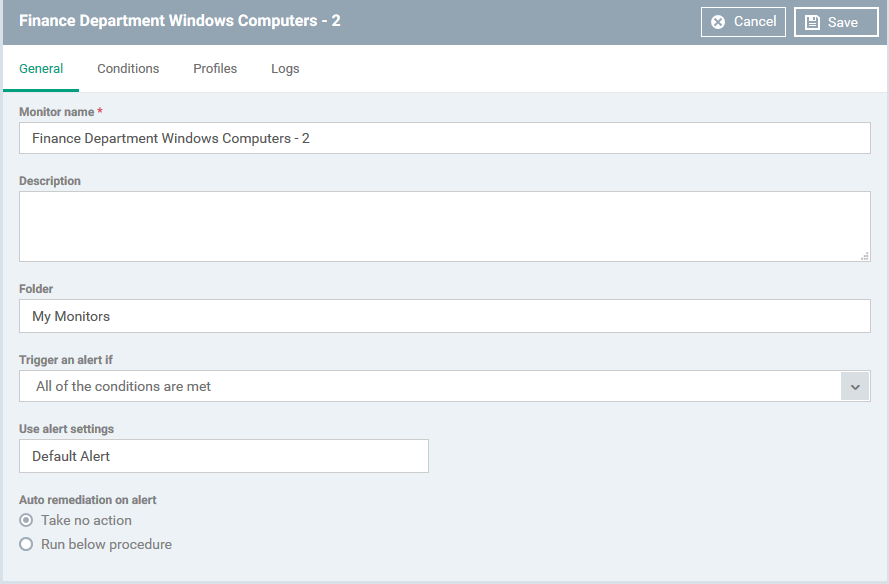
- This opens the monitor configuration screen:
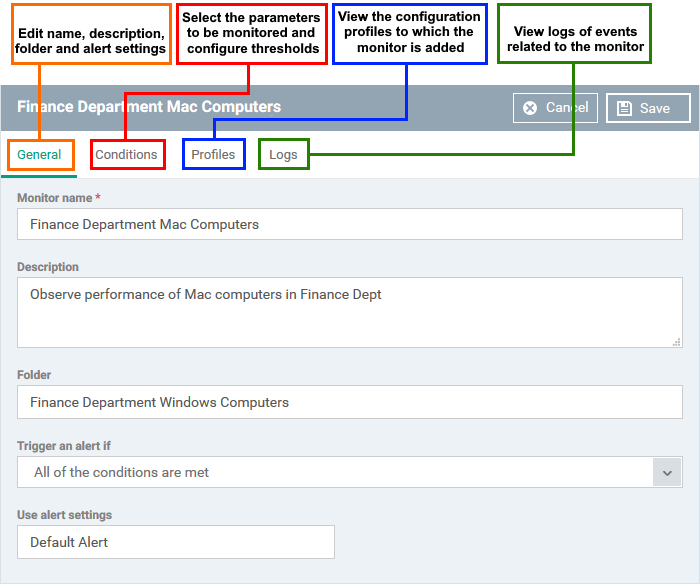
Modify the following settings if required:
Trigger an alert if - Select when admins should receive an alert. The options are (i) when all monitored conditions are met, or (ii) when any monitored condition is met.
Use Alert Settings - Choose the alert template. The alert template is a collection of settings that determine additional recipients and other settings.
- The ‘Default Alert’ template is a good starting point. It sends email alerts to admins and creates notifications in the portal itself.
- You can configure your own alert template at 'Configuration Templates' > 'Alerts'.
- See this page if you want more help to configure an alert template.
Auto Remediation on alert - Windows only. Choose how you want to respond to the alert:
- Taken no action - No automatic response is made to the alert. You can, of course, manually run a procedure in response to the alert.
- Run below procedure - Select a procedure to run on affected endpoints in response to the alert.
- The procedures listed here are defined in the 'Configuration Templates' > ' Procedures' interface.
- Type the first few characters of the procedure and select from the list.
- See this page if you want more help with procedures
- Click 'Save'
Choose what to monitor
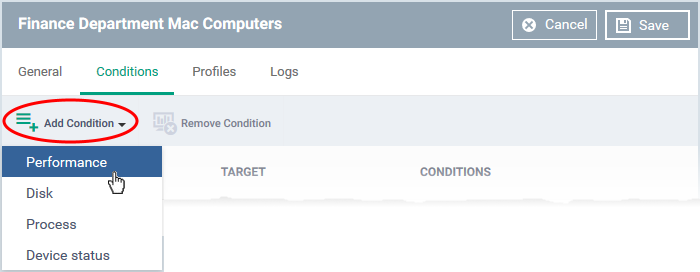
Choose the item you want to monitor:
- Performance - Checks CPU, RAM, Network and Disk usage. You are alerted if usage goes above (or below) a certain threshold.
- Disk - Checks free disk space and for large changes to free disk space in short periods, on system drive and other disk drives/partitions.
Triggers an alert if free disk space in any of the system drive or other drive partitions falls below a certain level, or if there are large alterations to disk space in a short time.
- Process - Checks whether or not a named process is running.
- Device Status - Checks every managed device to see whether it has been online or offline for a certain length of time.
- Background. Every minute, managed devices send a message to Endpoint Manager to signal that they are online. If EM does not receive this signal for three minutes then the device status is set to ‘Offline’. You will get an alert you if a device has been continuously ‘Offline’ (or ‘Online’) for the length of time you specify.
The following additional monitors are only available for Windows:
- File Size - Checks the disk space used by a specific file. Triggers an alert if the file is larger or smaller than the size you specify.
- Folder Size - Checks the disk space used by a directory. Triggers an alert if the folder is larger or smaller than the size you specify.
- Service - Checks whether or not a named service is running. Triggers an alert if the condition is met.
- Event - Checks if a specific event occurs and alerts you accordingly. You must specify the event ID, the criticality of the event, and the source of the event. The monitor checks Windows event logs for the information you enter.
- TCP - Checks whether a specific port is open or closed and alerts you accordingly. This is useful for important ports that need to remain open/closed for operational reasons.
You need to specify the hostname/ IP of the target port, the port number, the polling interval (in seconds), and whether you want to test for an open or closed state.
- Ping - Checks whether a host is online or not. You need to specify the hostname, fully qualified domain name (FQDN) or IP of the host, the polling interval (in seconds), and whether you want to test for online or offline status.
- Web Page - Checks whether specific content is present or not present on a web-page. You need to specify the URL, the text you want to search for and the polling interval (in minutes). You are alerted if the condition is met.
- Custom Script - Create a python script to monitor for your own set of conditions. Paste your script in the space provided. See Add a custom script to the monitoring condition if you need help with this.
- Security Events - Checks for significant security-related events on the managed endpoint. Example events:
- Malware detected and handled
- Malware detected and not handled
- Unknown application is placed in the container
- An external device was blocked by the device control
You can receive an alert when the condition is met, or automatically run a procedure.
- Security Client Events - Alerts you when there are errors with Comodo Client Security (CCS).
CCS is the endpoint application that provides the antivirus, firewall and containment services. This monitor checks for any failure in those processes, including:
- Antivirus scan failed or interrupted
- Antivirus database update failed
- Antivirus scan interrupted
- Another antivirus is installed
You can receive an alert when the condition is met, or automatically run a procedure.
- OS Patches Event - Alerts you when various types of Windows patch are installed. You can monitor the installation of:
- Critical Updates
- Definition Updates
- Upgrades
- Feature Packs
- Update Rollups
- Service Packs
- Tools
- Updates
- Security updates
Conditions and thresholds
After choosing the items you want to monitor, you can define the conditions upon which you receive an alert. The type of information you need to provide depends on the item monitored. For example, if you select 'Disk', you can specify conditions for one of three values:
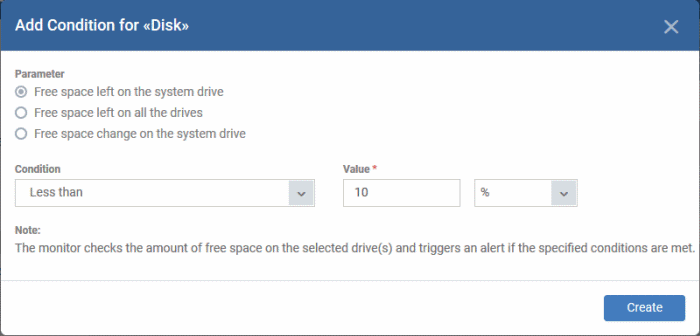
- Click 'Create' after specifying the conditions.
- Repeat the process to add more conditions
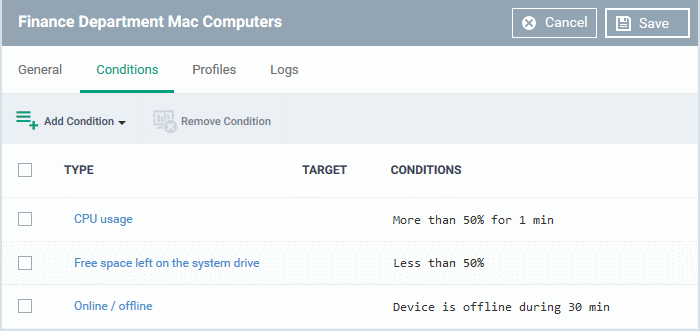
- Click 'Save' to apply your changes. Repeat the process to create more monitors.
- Next: You have the option to add custom scripts and/or variables or skip to Add the monitor to a profile.
Optional - Add a custom script to the monitor
You can create custom scripts in python and define which items should be monitored. You can also define the threshold before an alert is generated.
You can also add dynamic variables to the script. Values for the variables are fetched at run time.
- Choose 'Custom script' from the 'Add Condition' drop-down
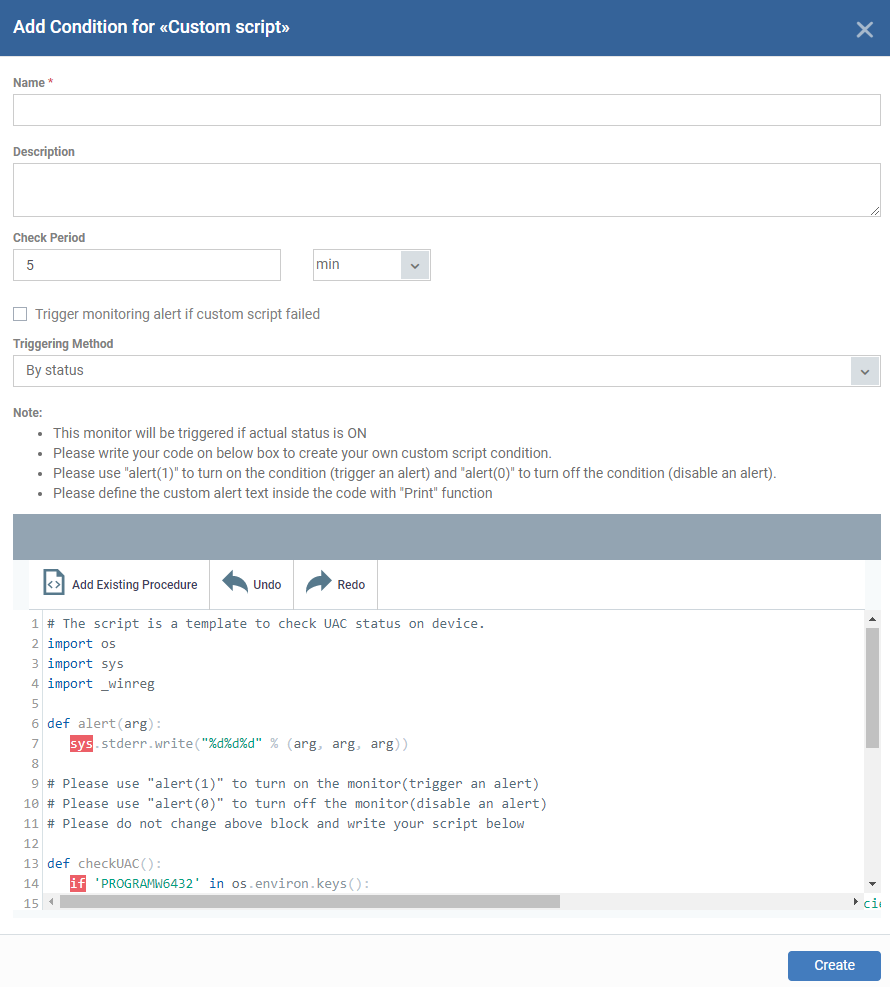
- Name - Create a label that identifies the purpose of the script.
- Description - Enter a short description of the script.
- Check Period - The time interval at which the script should run on the device. Ensure the check period is greater than the time taken for the script to run, so there is no overlap in successive executions.
- Trigger monitoring alert if custom script failed - Select if you want to be notified if the script did not run successfully.
- Triggering Methods - The new monitor triggering method generates an alert while the conditions are changed even when the monitor is 'ON' state. The users will be able to use this triggering method for getting alerts while their monitor is still on 'ON' state. Admin should be able to choose the following custom script monitoring triggering methods.
- By status - The monitor will be triggered if the actual status is ON
- By status changing - The monitor will be triggered if the status is changed from OFF to ON.
- Script - Enter your Python script in the text editor.
Note 1: Keep the following lines intact in the editor and enter your script below these:
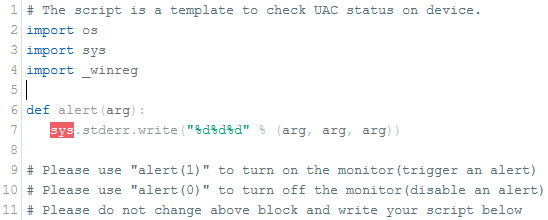
Note 2: If you want an alert to be triggered if the condition is met set the argument to alert parameter to 1, i.e. 'alert(1)'.
If you do not want an alert to be triggered even if the condition is met set the argument to alert parameter to 0, i.e. 'alert(0)'.
Note 3: You can import an existing script procedure in EM if you wish to create a new custom monitor script using an existing procedure as a starting point. Python script monitors by the ITarian development team are available in the 'Monitors' folder under 'Configuration Templates' > 'Procedures' > 'Predefined Procedures'.
- Click 'Add Existing Procedure' and choose the existing procedure.
- Edit the script as per your requirement as per Note 1.
- See this page for more details on procedures.
Note 4: In addition to the above, ITarian hosts a plethora of scripts at https://scripts.itarian.com/. Feel free to download python scripts for use here. If you require custom scripts from ITarian, please raise a request at https://forum.itarian.com/forum/script-library/4460-script-requests-itarian-team-will-write-the-scripts-for-you-for-free
Note 5: You can add variable parameters to your custom scripts. The values for the parameters are fetched at run time. Click here to know-how.
Optional - Add variables to your custom script
You can include variables whose values are dynamically populated when the monitor runs.
- Click 'Configuration Templates' > 'Monitors'
- Click 'Create Monitors'
- Complete the form as explained above.
- Click 'Add Condition' and select 'Custom script'
- See 'Add Custom Monitoring Conditions' explained above.
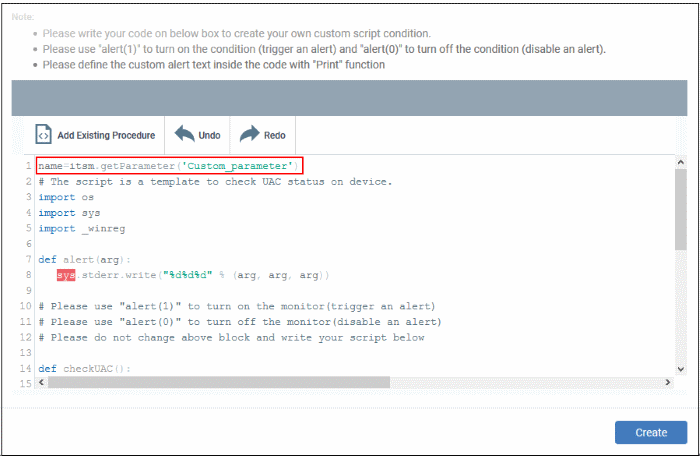
- Scroll down to the script area and enter the following code:
name=itsm.getParameter('parameterName')
- Repeat the process to add more parameters
- Complete the script and click 'Create'
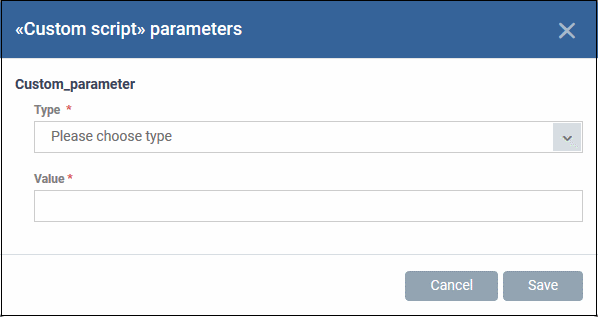
Custom script parameters dialogue box appears:
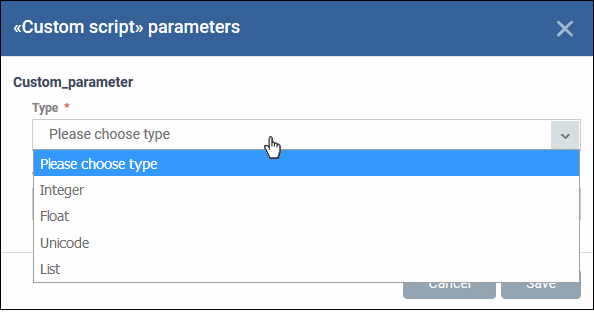
- Type - Select the parameter type from the drop-down. Available types are:
Integer
Float
Unicode
List
- Value - Enter the appropriate parameter value.
- Click 'Save'
Create a new monitor by cloning an existing monitor
- Cloning a monitor then modifying it is an easy way to create a custom monitor.
Clone a monitor
- Click 'Configuration Templates' > 'Monitors'
- Browse the folder tree on the left and locate the monitor you want to clone
- Select the source monitor then click 'Clone Monitor':
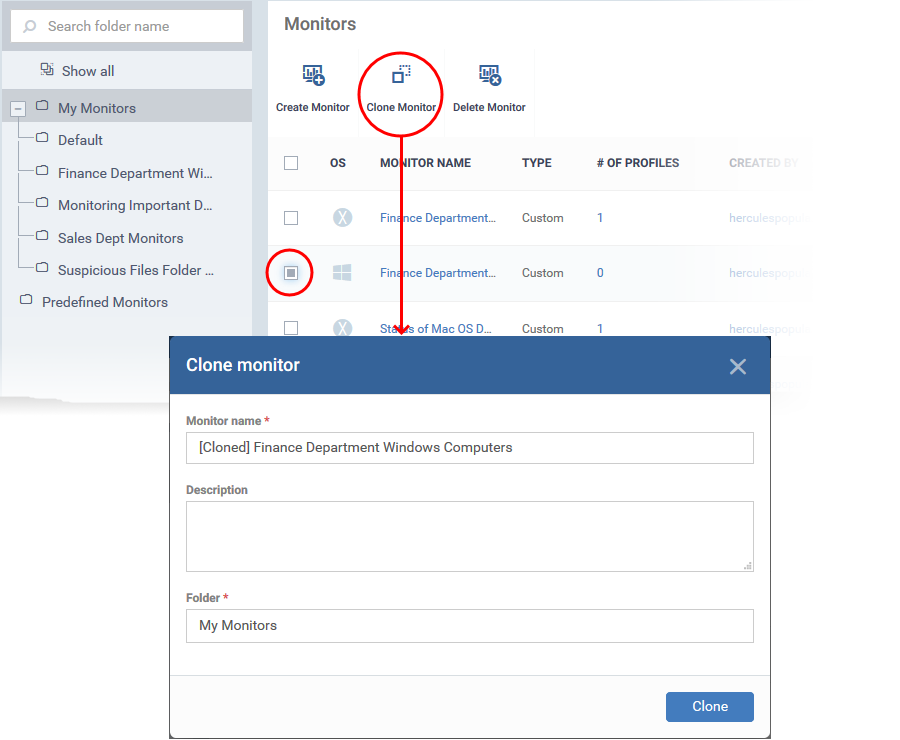
- Change the name, if required, and provide an appropriate description.
- Select the folder where you want to save the monitor. You can create new sub-folders under 'My Monitors' if required.
- Click 'Clone'
Next, we move onto the monitor configuration screen:
Update the parameters of the monitor as required. All settings are explained in the new monitor section above.
Add a monitor to a profile
- Log into ITarian
- Click 'Applications’ > ‘Endpoint Manager’
- Click 'Configuration Templates' > 'Profiles'
- Open the profile applied to your target devices
- Open the 'Monitors' tab
OR
- Click 'Add Profile Section' > 'Monitors', if you haven’t yet added the section
- Click 'Add Monitor'
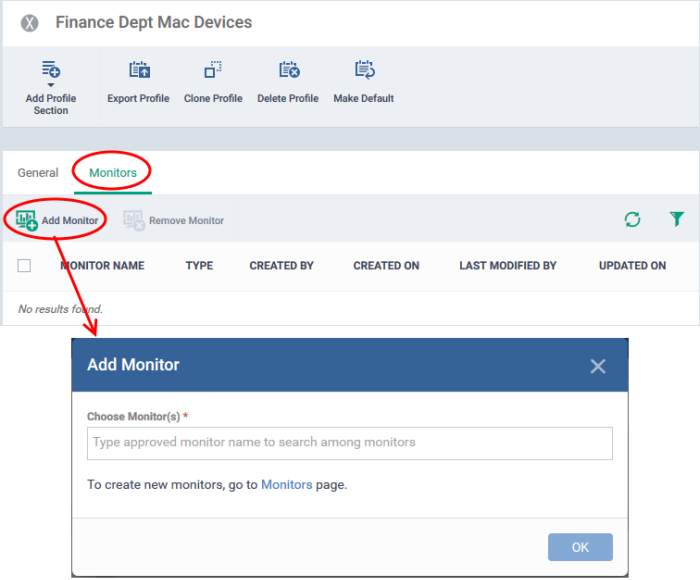
Choose Monitor(s) - Add monitors to the profile. Type the first few letters of a monitor name and select from the suggestions.
- Repeat the process to add more monitors to the profile
- Click 'OK' to add the monitors
The monitors screen shows all monitors added to the profile:
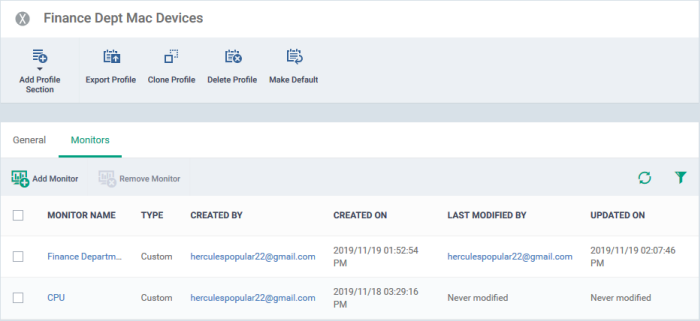
The monitors will be implemented on devices during the next sync. You will receive alerts whenever the conditions of a monitor are met.
View monitor logs
- Log into ITarian
- Click 'Applications’ > ‘Endpoint Manager’
- Click 'Configuration Templates' > 'Monitors'
- Click the name of a monitor to open its details screen
- Click the 'Logs' tab.
The logs tab shows all instances where the conditions of the monitor were breached:
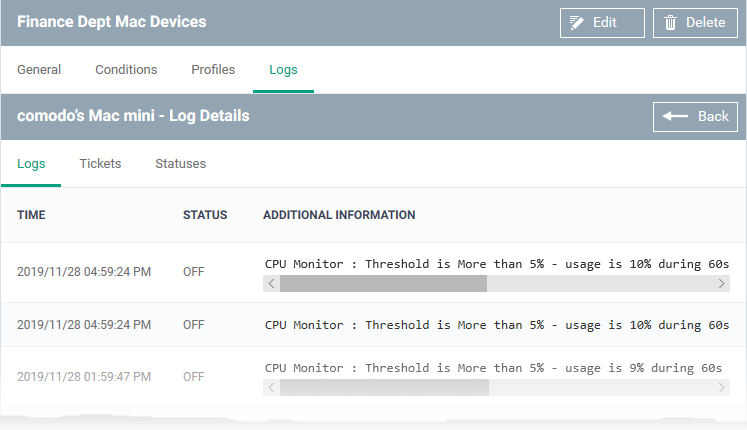
Details are shown in three tabs:
1) Logs - Date and time the event occurred, the condition that was broken.
- Time - Date and time of the event.
- Status - Shows whether or not the device is currently exceeding the monitored condition.
On - The device is currently exceeding the thresholds of the monitor
Off - The device is currently operating within the thresholds of the monitor
- Additional Information - Details on the condition monitored and the breach
2) Tickets - Shows service desk tickets which were auto-generated in response to the breached condition:
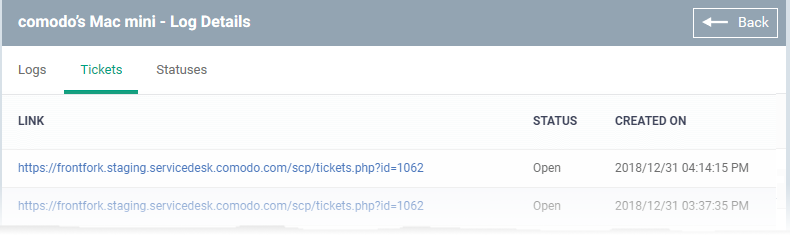
- Link - A link to the support ticket created for the breach event.
- Status - Shows whether the ticket is open or closed
- Created On - The date and time at which the ticket was created.
3) Statuses:
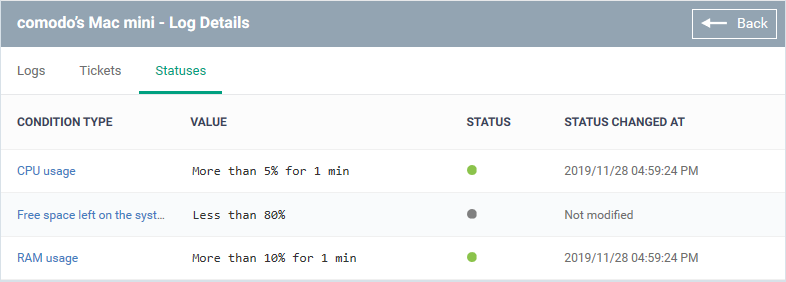
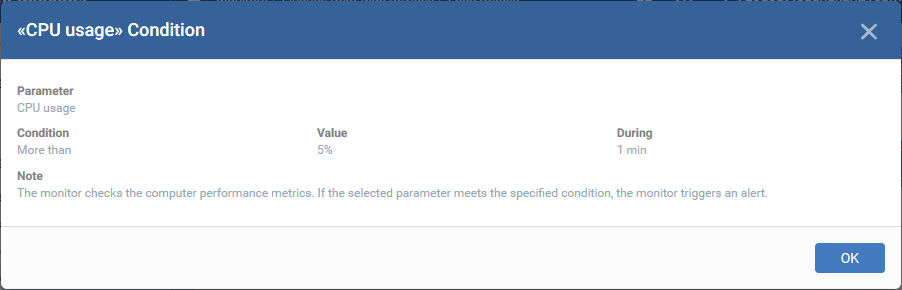
- Condition Type - The category of the monitor. Click the type to view its exact conditions and thresholds. An example is shown below:
- Value - The thresholds set for the parameter.
- Status - The current state of the monitored parameter on the device.
- Green - The device is operating within the thresholds of the monitor
- Grey - Unknown
- Red - The device is exceeding the conditions of the monitor.
- Status Changed at - The date and time of the most recent change to the monitored parameter.