The 'Logs' tab shows all events that occurred on a specific device. This contrasts to ‘Dashboard’ > ‘Audit Logs’, which shows events on all devices.
- Login to ITarian
- Click 'Applications' > 'Endpoint Manager'
- Click 'Devices' > 'Device List'
- Click the 'Device Management' tab
- Click the name of a Windows device
- Click the 'Logs' tab
There are eight types of a log, each on a different tab. Each row in these tabs is a specific event.
General Notes
- The first column shows the template that caused the log to be generated. This could be a named monitor, procedure, or discovery task.
- You can manage these templates in ‘Configuration Templates’ > ‘Alerts’ / ‘Procedures’ / ‘Monitors’
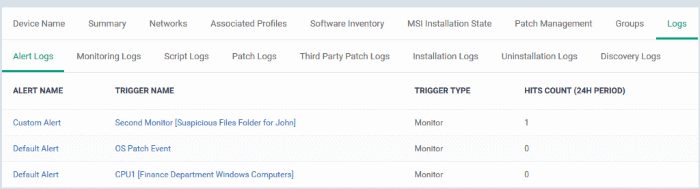
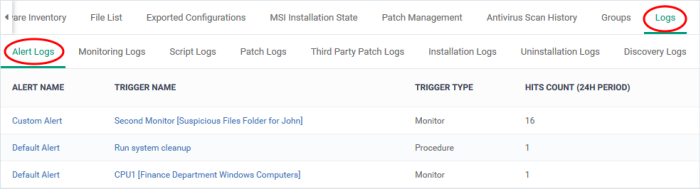
- The 'Alert Logs' tab has a slightly different layout. The template is shown in the ‘Trigger Name’ column
- The last column, ‘Details’, shows the contents of the log. Click this to view all activities in the event.
- Again, this is slightly different in the ‘Alert Logs’ tab. ‘Details’ is replaced with ‘Hit Count’.
Click on the following for details about each type of log:
Alert Logs - An alert is a notification which informs admins if a procedure fails, or when certain conditions are met in a monitor.
For example, 'Generate an alert if CPU usage exceeds 90%', or 'Alert me when all Windows patches have been installed'.
Alert Name - The alert template used in the event.
- An alert template is just a collection of settings that determine alert recipients, information included, priority, etc. The alert template does not specify the conditions under which the alert was generated.
- The 'Trigger Name' is the procedure/monitor that actually caused the event. You also enable or disable the alert itself from the procedure/monitor edit screen.
- You apply the alert template to a procedure/monitor to define the scope of the alert.
- In the standard workflow, all procedures and monitors have the 'Default Alert' template applied to them.
- You can also create your own alert templates. Click here for help to manage alert templates.
Trigger Name - The monitor or procedure that caused the alert.
- Procedures – An alert is created if a procedure fails. Click here for help on procedures.
- Monitors – An alert is created when one or more of the monitor's conditions are met. Click here for help on monitors.
Trigger Type – Can be 'Monitor' or 'Procedure' as explained above.
Hit Count (24 H Period) - The number of times this condition was triggered in the past 24 hours.
Monitoring Logs - Shows events that met the conditions of a monitor.
- A monitor is a routine which keeps track of specific items on an endpoint. For example, you may set a monitor to track disk usage and alert you if it goes above a certain %.
- You can also configure a monitor to run a procedure, or create a service desk ticket if its conditions are met.
- You first create a monitor then you add it to the 'Monitoring' section of a profile.
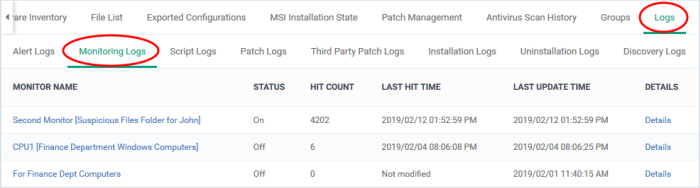
- Monitor name - The monitor that was triggered to create the log.
- Click the name to view and manage the settings of the monitor.
- Status - Whether or not the monitor is currently active on the device.
- Hit count - The number of times the monitored condition was breached during the last 24 hours.
- Last hit time - Date and time the monitored rule was last broken.
- Last update time - Date and time when the information was last refreshed.
- Details - Click the 'Details' link to see all activities in the event.
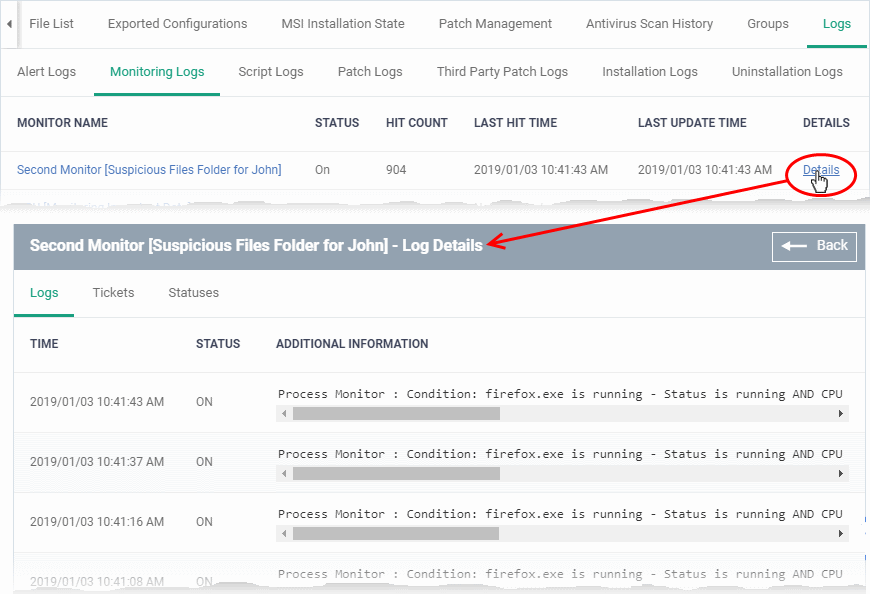
Details are shown in three tabs:
- Logs - Date and time the event occurred. It also shows the monitoring rule that detected the event.
- Tickets - Shows any service desk tickets created by the events.
- Statuses - Shows the current status of all conditions monitored on the device.
Script Logs - Shows script procedures that were manually run on Windows devices, and scripts that were auto-run via a profile.
- EM ships with a number of pre-defined script procedures for various tasks. For example, 'Get Software Inventory', 'Enable Windows Firewall', 'Check Disk Errors'. You can also compose your own Python scripts in the built-in editor.
- Script procedures can be added to a profile and run at a scheduled time. You can also manually run them on target devices at any time
.
- A log is created each time a script procedure runs. The log contains details about the script and states whether it executed successfully.
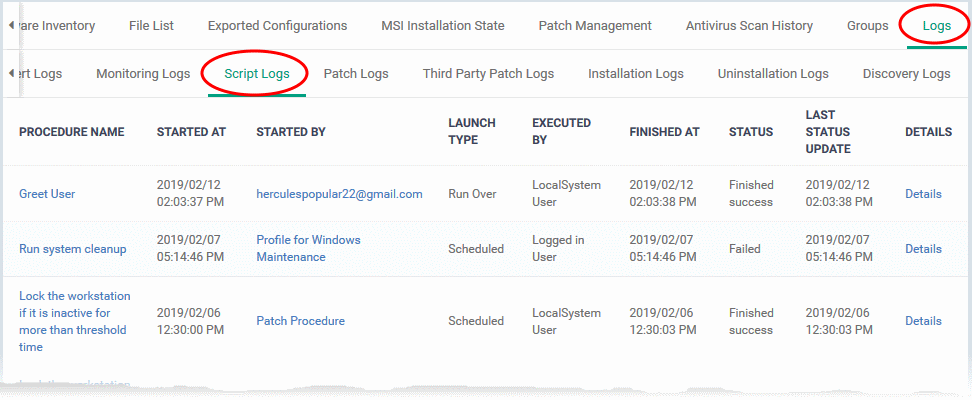
- Procedure Name - The label of the script procedure that was run on the device.
- Click the procedure name to view script details.
- Started by - Who or what launched the procedure.
- A profile name is shown here if the script was scheduled in a profile.
- An admin’s name or email is shown if the procedure was run manually.
- Launch type - How the procedure was launched. This is linked to the ‘Started by’ column:
- Scheduled - The script ran because it was scheduled in a profile.
- Run over - The script was manually run by an admin.
- Executed By - The user account type used by EM to execute the procedure.
- Finished At - Date and time the procedure completed.
- Status - Whether the script successfully executed or not.
- You can configure an alert if a procedure deployment fails.
- Last Status Update - The date and time the information was last updated.
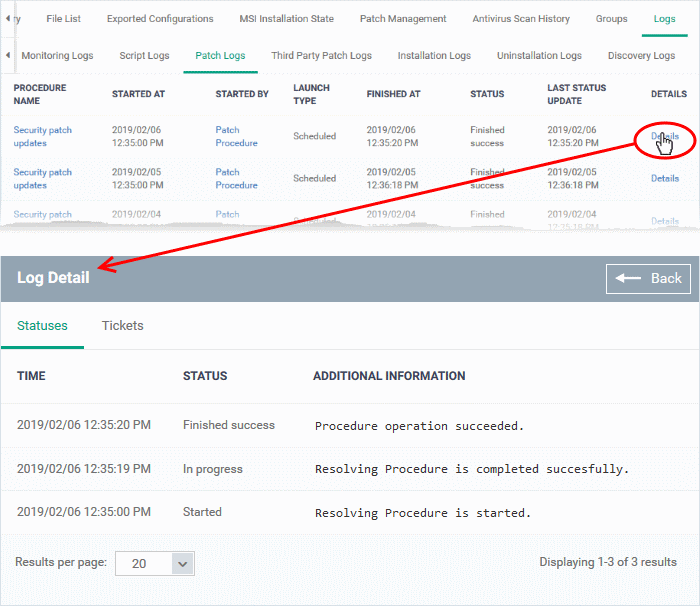
- Details - Click the 'Details' link to view a log of the procedure's execution.
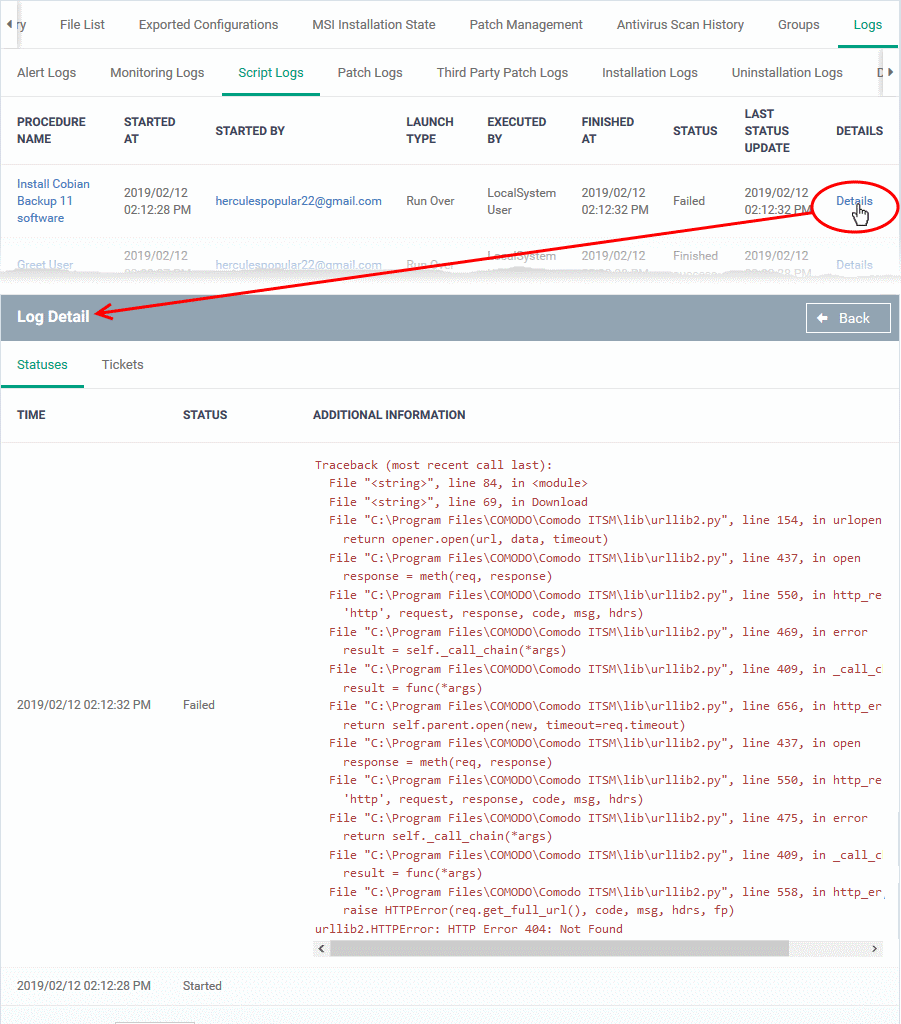
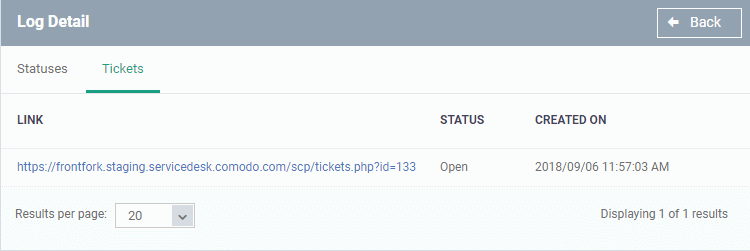
Details are shown over two tabs:
- Statuses - Date and time that each stage of the procedure ran, its success status, and result.
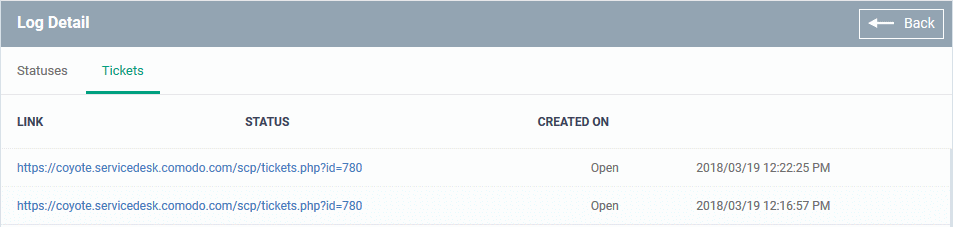
- Tickets - Shows Service Desk tickets generated because of a failed procedure.
Patch Logs – Operating system patch procedures that ran as part of a profile, or were manually run by an admin.
- You can view and create procedures at 'Configuration Templates' > 'Procedures' > 'Predefined Procedures' > 'Patch Deployment'
- Click here if you want more help on procedures
A log is created each time a patch procedure runs. The log contains details about the patch and states whether or not it ran successfully.
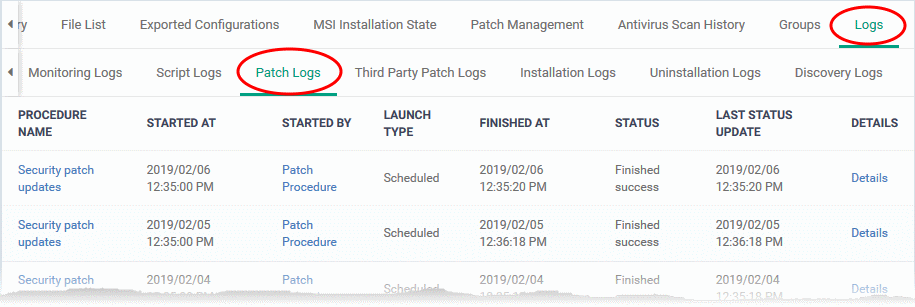
- Procedure Name - Click the procedure name to view its details.
- Started at - Date and time the procedure commenced.
- Started by - Who or what launched the procedure.
- A profile name is shown here if the script was scheduled in a profile.
- An admin’s name or email is shown if the procedure was run manually.
- Launch type - This is linked to the ‘Started by’ column:
- Scheduled - The script ran because it was scheduled in a profile.
- Run over - The script was manually run by an admin.
- Finished At - The date and time the procedure completed.
- Status – Indicates whether the patch is installed, not yet installed, or installed but the endpoint needs rebooting
- Last Status Update - The date and time when the information was last updated.
- Details - Click the 'Details' link to view a log of the procedure's execution.
Details are shown across two tabs:
- Statuses - Date and time that each stage of the procedure ran, its success status, and result.
- Tickets - Shows Service Desk tickets generated because of a failed procedure.
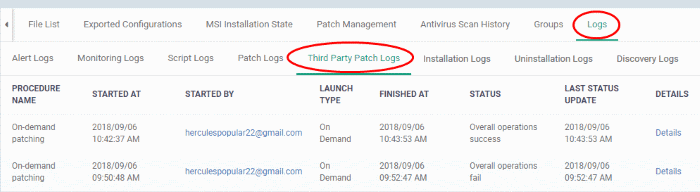
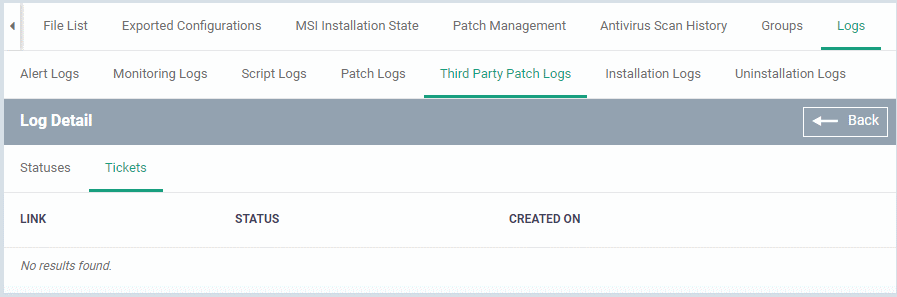
Third party patch logs – Procedures to patch 3rd party software on the devices. It contains logs of procedures that ran as part of a profile or were manually run by an admin.
- You can view and create procedures at 'Configuration Templates' > 'Procedures' > 'Predefined Procedures' > 'Patch Deployment'
- Click here if you want more help on procedures
A log is created each time a patch procedure runs. The log contains details about the patch and states whether or not it ran successfully.
- Procedure Name - Click the procedure name to view its details.
- Started at - Date and time the procedure commenced.
- Started by - Who or what launched the procedure.
- A profile name is shown here if the script was scheduled in a profile.
- An admin’s name or email is shown if the procedure was run manually.
- Launch type - This is linked to the ‘Started by’ column:
- Scheduled - The script ran because it was scheduled in a profile.
- Run over - The script was manually run by an admin.
- Finished At - The date and time the procedure completed.
- Status – States whether the procedure was successful or not.
- You can set an alert if a procedure fails.
- Last Status Update - The date and time when the information was last updated.
- Details - Click the 'Details' link to view a log of the procedure's execution.
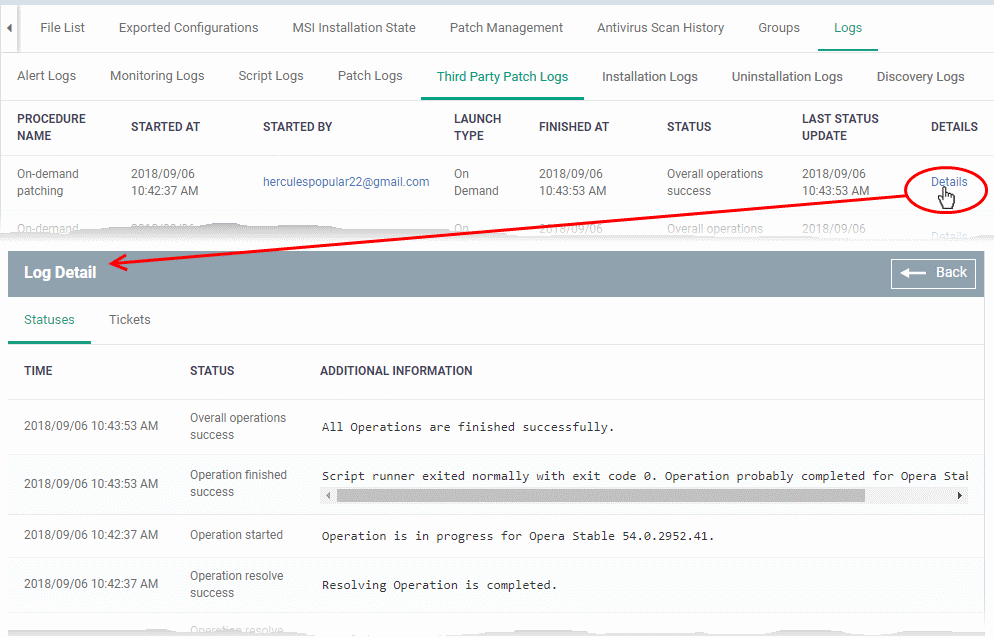
Details are shown across two tabs:
- Statuses - Date and time that each stage of the procedure ran, its success status, and result.
- Tickets - Shows Service Desk tickets generated because of a failed procedure.
Installation Logs - Shows installations of third party applications from the Windows application Store ('Application Store' > 'Windows Application Store').
- See this wiki for help to deploy applications from the store to managed devices
A log is created each time an application is remotely installed on a device. The log contains details about the installation, and whether or not it was successful.
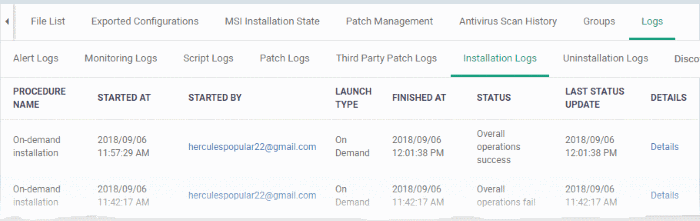
- Procedure Name - The only possible value is 'On-demand installation'. This means the app was pushed from 'Application Store' > 'Windows Application Store'.
- Started at - The date and time the installation commenced.
- Started by - The admin who started the remote installation.
- Launch type - The only possible value is 'On Demand'. This means the install was manually run by an admin from the EM console.
- Finished At - The date and time the procedure completed.
- Status - States whether the procedure was successful or not.
- Last Status Update - The date and time when the information was last updated.
- Details - Click the 'Details' link to view a log of the procedure's execution.
Uninstallation Logs - Logs about the removal of third party applications from devices.
There are two ways in which you can remotely uninstall applications:
'Device Details' interface – Uninstall apps from an individual device.
- Click 'Devices' > 'Device List' > 'Device Management'
- Click the name of a Windows device and select the 'Software Inventory' tab
- Select the applications and click 'Uninstall Selected Application' on the top
'Global Software Inventory' interface – Uninstall apps from all managed devices.
- Click 'Application' > 'Global Software Inventory'
- Select the application to be uninstalled
- Click 'Uninstall' on the top
A log is created each time an application is remotely removed from a device.
- Procedure Name - The only possible value is 'On-demand Uninstallation'.
- Started at - Date and time the uninstall began.
- Started by - The admin who started the uninstall operation.
- Launch type - Shows whether the uninstall was scheduled or manual. The only possible value is 'On Demand'.
- Finished At - The date and time the procedure completed.
- Status - States whether the procedure was successful or not.
- Last Status Update - The date and time when the information was last updated.
- Details - Click the 'Details' link to view a log of the uninstallation stages
Discovery Logs – Shows network discovery scans run from the device.
- Any managed Windows device can be used as a probe device to run discovery scans on a network.
- The discovery logs tab shows any such scans run from this device.
- See this wiki if you want to learn more about network discovery scans.
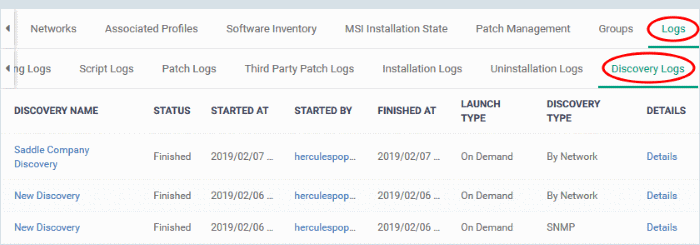
- Discovery Name - Click the discovery name to view its details.
- Status - States whether the procedure was successful or not.
- Started At - Date and time the procedure commenced.
- Started By - The admin who launched the scan.
- Finished At - Date and time the scan ended.
- Launch Type - How the scan was started. For example, 'On Demand' means it was manually started by an admin.
- Type of Discovery - Can be an SNMP scan or network (IP) scan.
- Details - Click the 'Details' link for more information about the scan. For example, this will tell you the number of devices found and their names.
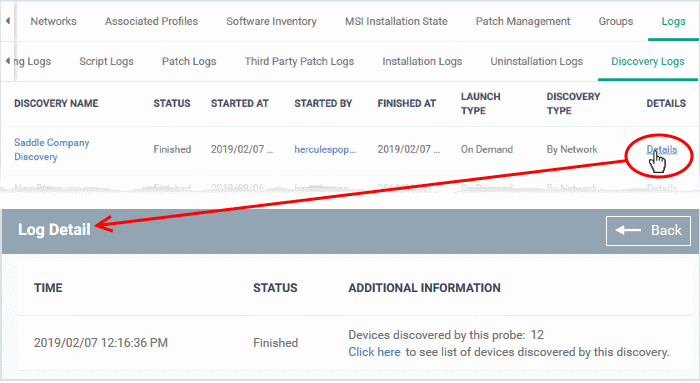
- Click the 'Click here' link to view the devices found by the scan.